73 Bruce StreetNedlands WA 6009
Property Details for 73 Bruce St, Nedlands
73 Bruce St, Nedlands is a 4 bedroom, 2 bathroom House with 2 parking spaces and was built in 1928. The property has a land size of 814m2 and floor size of 178m2. While the property is not currently for sale or for rent, it was last sold in September 2021.
Last Listing description (October 2021)
Expressions of Interest - Buyers above $1,900,000
Closing 4pm, 13th October 2021 - Unless Sold Prior
High ornate ceilings, polished jarrah floorboards and stained glass motifs set in leadlight windows.
Four bedrooms, two bathrooms, large formal lounge, formal dining and family room.
Superbly renovated kitchen with Caesarstone benchtops and Miele appliances.
Located on a large landscaped 814sqm block.
Double carport and lock up store room.
Conveniently located close to UWA, Broadway Fair Shopping Centre, the cafe strip, public and private schools, Hollywood Hospital, QEII and the new Children's' Hospital.
Be Quick! Others will be interested
City of Nedlands 2021/2022: $2,814.41
Water Corporation 2021/2022: $1,850.57
Important Information Regarding Expressions of Interest
The Seller reserves the right to sell the property at any time before the closing date. Accordingly interested parties are strongly advised to immediately make an appointment with Greg Rossen to draft and lodge an Expression of Interest which must be on a standard REIWA Offer and Acceptance form stating price, terms and conditions. Please note that the terms of this sale require potential purchasers to draft the offer with Greg Rossen.
Property History for 73 Bruce St, Nedlands, WA 6009
- 24 Sep 2021Sold for $2,100,000
- 16 Sep 2021Listed for Sale Expressions of Interest - Buyers above $1,900,000
- 15 Jul 2020Listed for Rent $850 / week
Commute Calculator
Recent sales nearby
See more recent sales nearbySimilar properties For Sale nearby
See more properties for sale nearby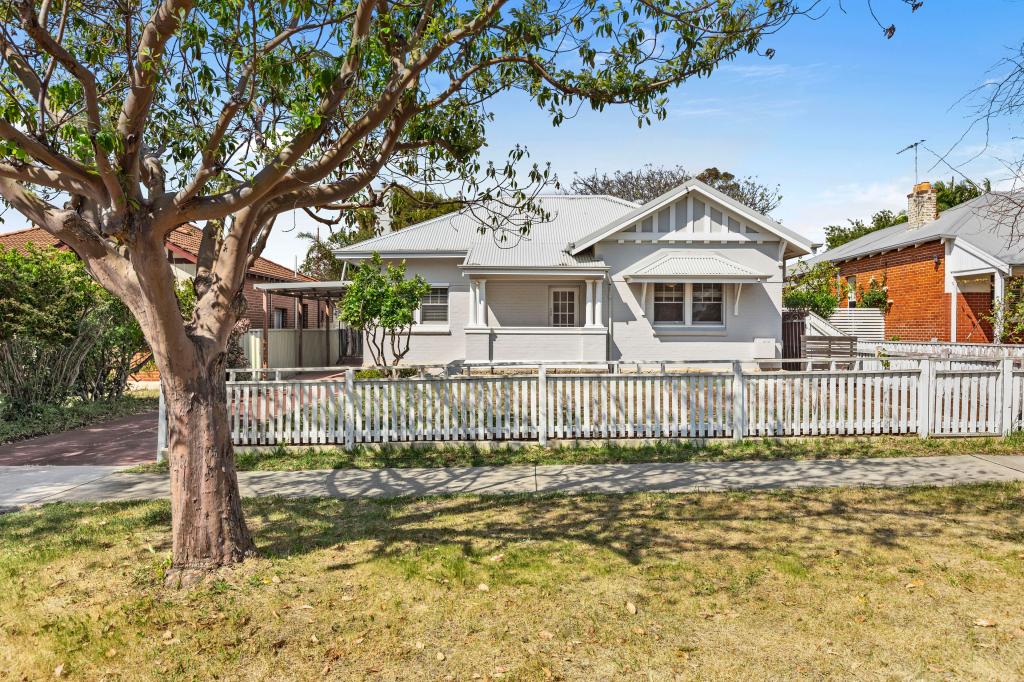 0
0 0
0
 0
0Similar properties For Rent nearby
See more properties for rent nearby 0
0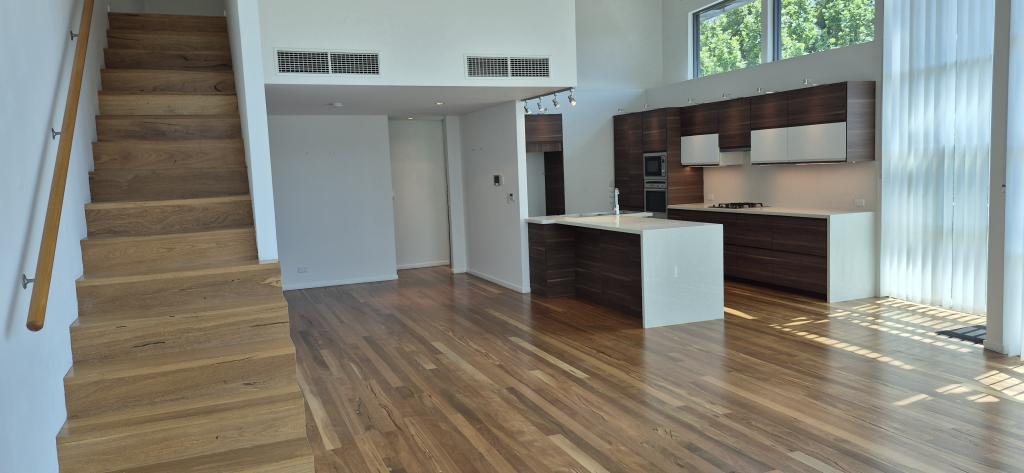 0
0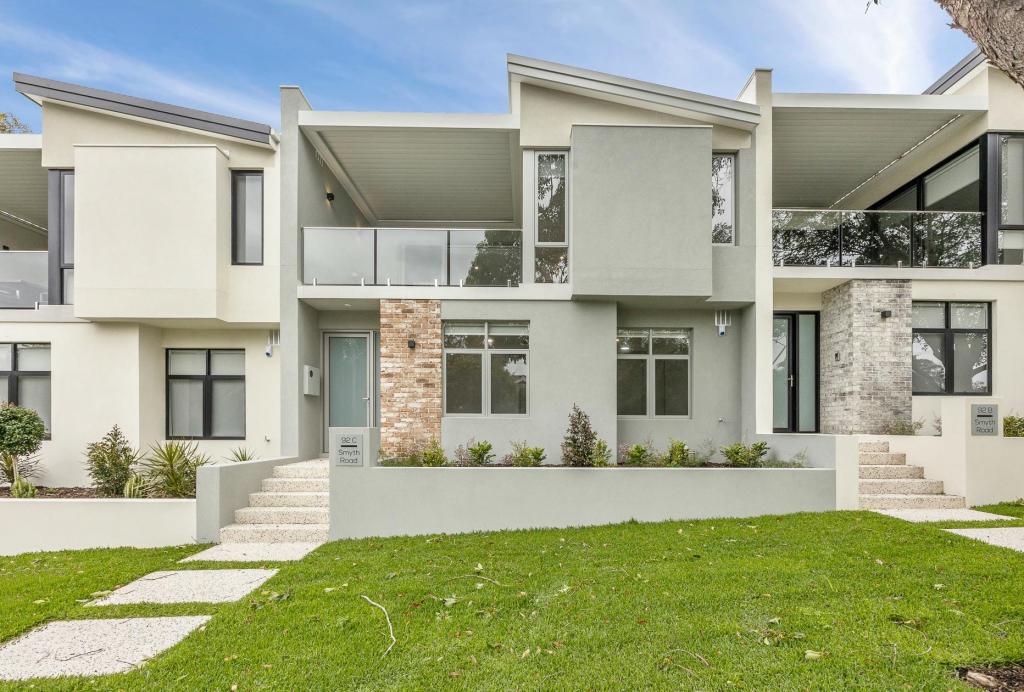 0
0
About Nedlands 6009
The size of Nedlands is approximately 5.3 square kilometres. It has 18 parks covering nearly 11.3% of total area. The population of Nedlands in 2011 was 10,183 people. By 2016 the population was 10,192 showing a population growth of 0.1% in the area during that time. The predominant age group in Nedlands is 20-29 years. Households in Nedlands are primarily couples with children and are likely to be repaying over $4000 per month on mortgage repayments. In general, people in Nedlands work in a professional occupation. In 2011, 68.8% of the homes in Nedlands were owner-occupied compared with 70.9% in 2016.
Nedlands has 5,139 properties. Over the last 5 years, Houses in Nedlands have seen a 60.87% increase in median value, while Units have seen a 69.75% increase. As at 31 October 2024:
- The median value for Houses in Nedlands is $2,304,269 while the median value for Units is $872,715.
- Houses have a median rent of $1,100 while Units have a median rent of $695.
Suburb Insights for Nedlands 6009
Market Insights
Nedlands Trends for Houses
N/A
N/A
View TrendN/A
N/A
Nedlands Trends for Units
N/A
N/A
View TrendN/A
N/A
Neighbourhood Insights
© Copyright 2024 RP Data Pty Ltd trading as CoreLogic Asia Pacific (CoreLogic). All rights reserved.
This product uses cookies and other similar technologies to improve and customise your browsing experience, to tailor content and adverts, and for analytics and metrics regarding visitor usage on this product and other media. We may share cookie and analytics information with third parties for the purposes of advertising. By continuing to use our website, you consent to cookies being used. View our Privacy Policy here.
X