31 Losino BoulevardHenley Brook WA 6055
Property Details for 31 Losino Bvd, Henley Brook
31 Losino Bvd, Henley Brook is a 4 bedroom, 2 bathroom House with 2 parking spaces and was built in 2001. The property has a land size of 594m2 and floor size of 124m2. While the property is not currently for sale or for rent, it was last sold in December 2008.
Last Listing description (December 2008)
DIP AND SIP BY THE POOL OPEN SUNDAY 31/08/08 1.30-2.15PM
POOL PARTY IDEAS COME NATURALLY IN THIS PROUD-TO-SHOW BACKYARD WITH BEAUTIFULLY LIT SALT WATER POOL BOARDED BY TROPICAL GARDENS, TIMBER DECKED GAZEBO AND SPACIOUS COLOURBOND PATIO. THE OPEN PLAN HOME OFFERS 4 BEDROOMS, 2 BATHROOMS, FORMAL LOUNGE, KITCHEN, MEALS, FAMILY, GAMES, DUCTED AIR CON, GAS APPLIANCES, DOUBLE REMOTE CONTROL GARAGE WITH SHOPPERS ENTRANCE. FULLY LANDSCAPED GARDENS WITH WATER FEATURE AT THE FRONT DOOR. PUT SOME FUN AND HEALTHY LIVING IN YOUR LIFE!!!
Property History for 31 Losino Bvd, Henley Brook, WA 6055
- 29 Dec 2008Sold for $415,000
- 09 Sep 2008Listed for Sale $425,000 - $455,000
- 06 Apr 2008Listed for Sale +
Commute Calculator
Recent sales nearby
See more recent sales nearby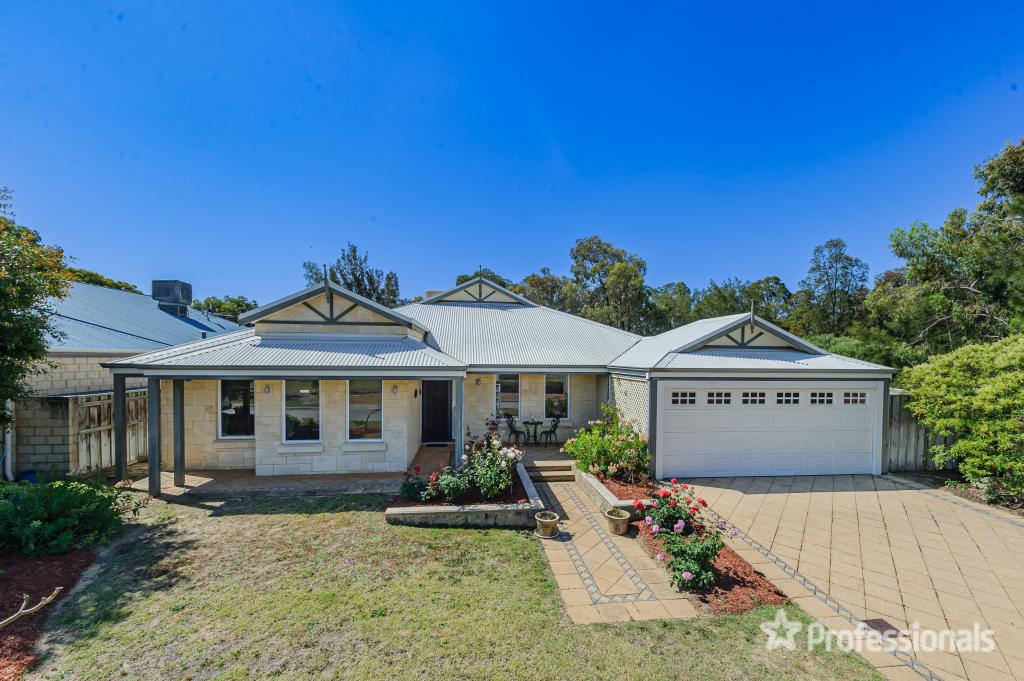 0
0 0
0 0
0Similar properties For Sale nearby
See more properties for sale nearby 0
0 0
0 0
0Similar properties For Rent nearby
See more properties for rent nearby 0
0 0
0 0
0
About Henley Brook 6055
The size of Henley Brook is approximately 13.3 square kilometres. It has 11 parks covering nearly 6.4% of total area. The population of Henley Brook in 2011 was 2,642 people. By 2016 the population was 2,498 showing a population decline of 5.5% in the area during that time. The predominant age group in Henley Brook is 10-19 years. Households in Henley Brook are primarily couples with children and are likely to be repaying $1800 - $2399 per month on mortgage repayments. In general, people in Henley Brook work in a trades occupation. In 2011, 82.1% of the homes in Henley Brook were owner-occupied compared with 82.1% in 2016.
Henley Brook has 1,805 properties. Over the last 5 years, Houses in Henley Brook have seen a 89.13% increase in median value, while Units have seen a -35.88% decrease. As at 30 November 2024:
- The median value for Houses in Henley Brook is $801,920 while the median value for Units is $420,452.
- Houses have a median rent of $710.
Suburb Insights for Henley Brook 6055
Market Insights
Henley Brook Trends for Houses
N/A
N/A
View TrendN/A
N/A
Henley Brook Trends for Units
N/A
N/A
View TrendN/A
N/A
Neighbourhood Insights
© Copyright 2024 RP Data Pty Ltd trading as CoreLogic Asia Pacific (CoreLogic). All rights reserved.
This product uses cookies and other similar technologies to improve and customise your browsing experience, to tailor content and adverts, and for analytics and metrics regarding visitor usage on this product and other media. We may share cookie and analytics information with third parties for the purposes of advertising. By continuing to use our website, you consent to cookies being used. View our Privacy Policy here.
X