9 Quadrant ApproachWilliams Landing VIC 3027
Property Details for 9 Quadrant App, Williams Landing
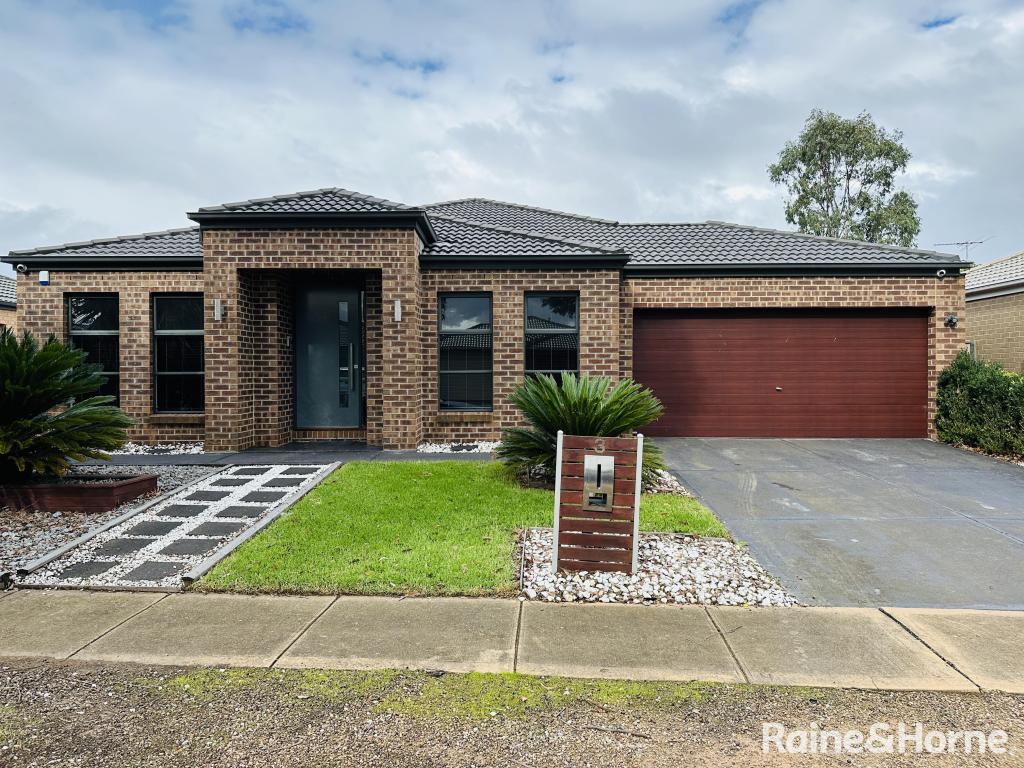
9 Quadrant App, Williams Landing is a 4 bedroom, 2 bathroom House with 2 parking spaces and was built in 2016. The property has a land size of 448m2 and floor size of 306m2. While the property is not currently for sale or for rent, it was last sold in August 2024. There are 0 other 4 bedroom House sold in Williams Landing in the last 12 months.
Last Listing description (July 2014)
The front portion of the Cornell offers a large master bedroom & separate living room, perfect for catching a movie. The rear of the home brings is the kids territory, complete with 2 or 3 bedrooms, bathroom & separate toilet, all conveniently bordered off by their own passageway. An open-plan kitchen, meals & family area allow everyone to come together & share a meal as a family.
***$10000 First Home Owners Grant Has Been Deducted - Conditions Apply***
*Copyright conditions.
Property History for 9 Quadrant App, Williams Landing, VIC 3027
- 20 Aug 2024Sold for $1,260,000
- 22 Jul 2014Sold for $339,000
- 08 Jul 2014Listed for Sale $510,900
Local Area Liveability Score
This Liveability Score is a rating "out of 10" and a guide to how well connected properties within a local area are to facilities such as public transport, healthcare services, shopping outlets, schools and parkland. The scores apply to the local area (or "mesh block") in which a property is located. The scores are largely comprised of 2 main elements:
- Walking time to a local facility
- Number of facilities within a 20-minute walk
The overall Liveability Score is made up of smaller sub-scores, as described below.
Recent sales nearby
See more recent sales nearbySimilar properties For Sale nearby
See more properties for sale nearby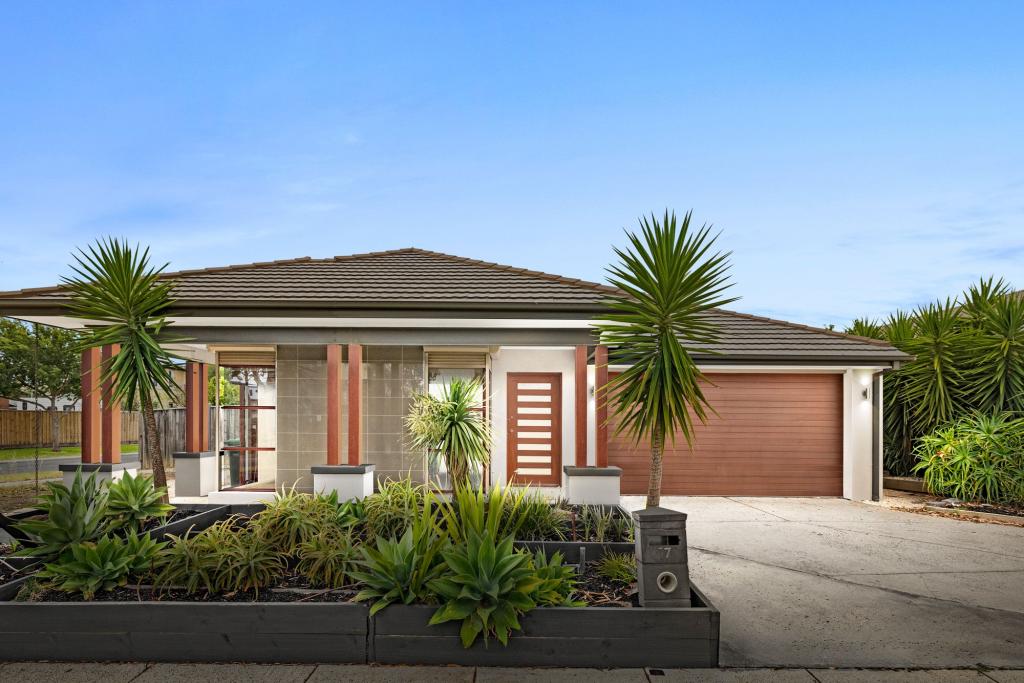
Similar properties For Rent nearby
See more properties for rent nearby
About Williams Landing 3027
The size of Williams Landing is approximately 3.8 square kilometres. It has 16 parks covering nearly 33% of total area. The population of Williams Landing in 2011 was 3,222 people. By 2016 the population was 6,651 showing a population growth of 106.4% in the area during that time. The predominant age group in Williams Landing is 30-39 years. Households in Williams Landing are primarily couples with children and are likely to be repaying $1800 - $2399 per month on mortgage repayments. In general, people in Williams Landing work in a professional occupation. In 2011, 74.7% of the homes in Williams Landing were owner-occupied compared with 66.3% in 2016.
Williams Landing has 4,341 properties. Over the last 5 years, Houses in Williams Landing have seen a 16.84% increase in median value, while Units have seen a 8.91% increase. As at 28 February 2025:
- The median value for Houses in Williams Landing is $766,884 while the median value for Units is $451,353.
- Houses have a median rent of $595 while Units have a median rent of $490.
What's around 9 Quadrant App, Williams Landing
9 Quadrant App, Williams Landing is in the school catchment zone for Truganina South Primary School.


Suburb Insights for Williams Landing 3027
Market Insights
Williams Landing Trends for Houses
$767k
-1.75%
View Trend$595/W
4.00%
Williams Landing Trends for Units
$451k
-5.42%
View Trend$490/W
5.72%
Neighbourhood Insights
Age
Population 6,651
0-9
22%
10-19
10%
20-29
15%
30-39
29%
40-49
13%
50-59
7%
60-69
4%
70-79
1%
Household Structure
Occupancy
© Copyright 2025 RP Data Pty Ltd trading as CoreLogic Asia Pacific (CoreLogic). All rights reserved.
This product uses cookies and other similar technologies to improve and customise your browsing experience, to tailor content and adverts, and for analytics and metrics regarding visitor usage on this product and other media. We may share cookie and analytics information with third parties for the purposes of advertising. By continuing to use our website, you consent to cookies being used. View our Privacy Policy here.
X