22 Romilly AvenueManningham SA 5086
Property Details for 22 Romilly Ave, Manningham
22 Romilly Ave, Manningham is a 3 bedroom, 1 bathroom House with 3 parking spaces and was built in 1992. The property has a land size of 397m2 and floor size of 131m2. While the property is not currently for sale or for rent, it was last sold in December 2014.
Last Listing description (November 2014)
- Open plan kitchen and casual living
- Formal lounge and dining area
- Built in robes, and ceiling fans to 2 bedrooms
- Secure garaging for up to 3 cars
- Covered and paved outdoor entertaining area
- Easy walk to the park and tennis courts
- Close to public transport for direct access to the city
- Land size 397sqm (approx.)
Property History for 22 Romilly Ave, Manningham, SA 5086
- 04 Dec 2014Sold for $468,000
- 08 Oct 2014Listed for Sale $470,000
- 10 May 2010Sold for $481,000
Commute Calculator
Recent sales nearby
See more recent sales nearbySimilar properties For Sale nearby
See more properties for sale nearby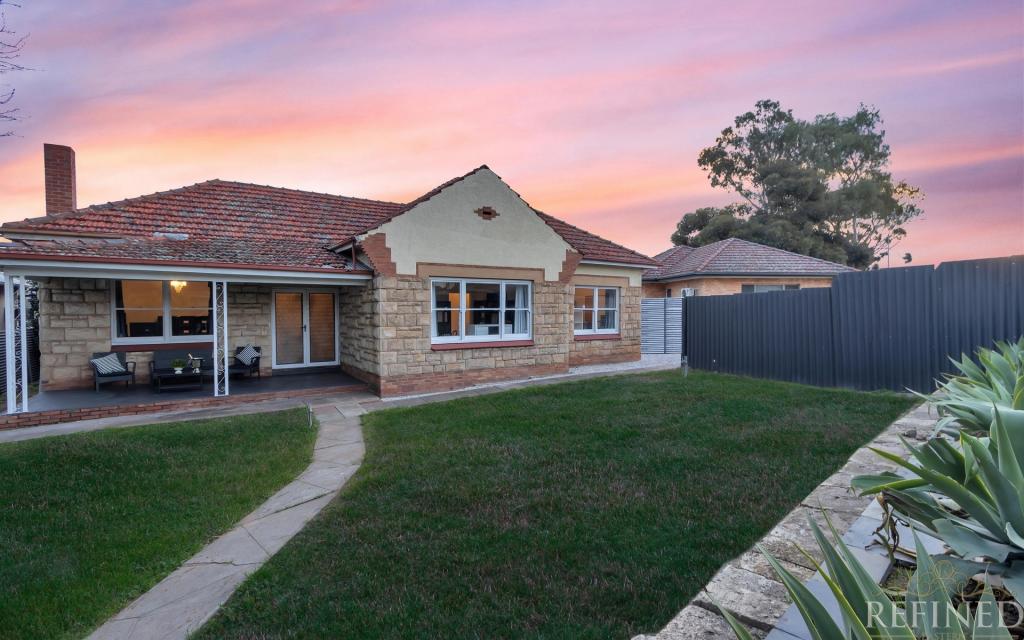 0
0 0
0
 0
0Similar properties For Rent nearby
See more properties for rent nearby 0
0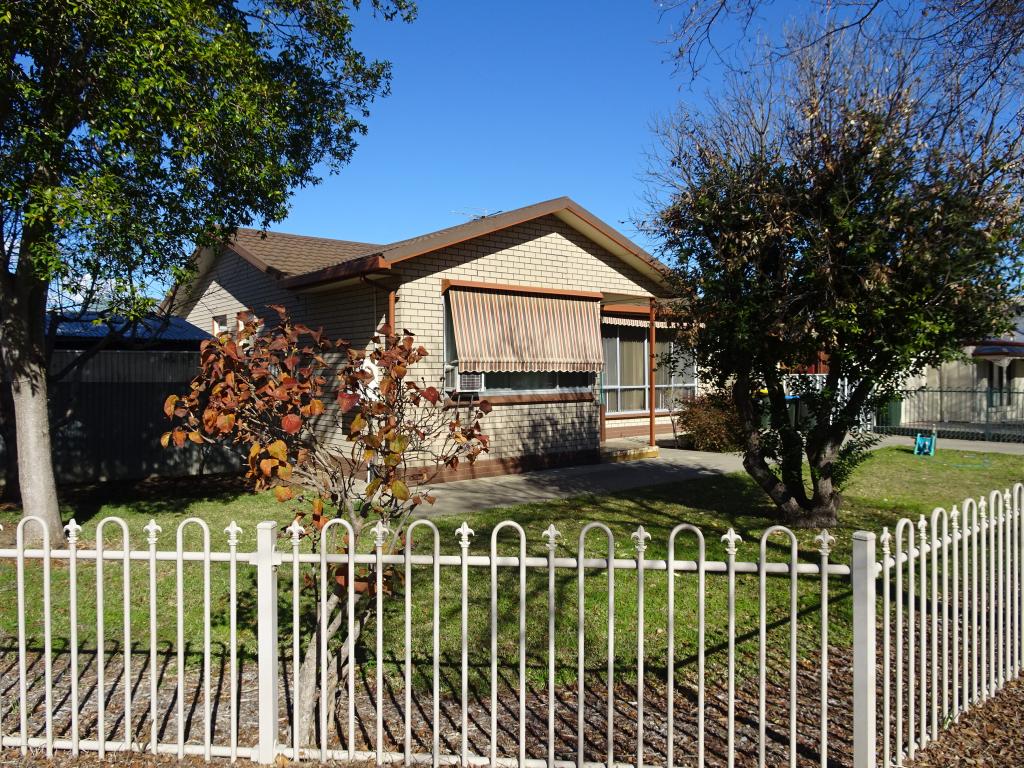 0
0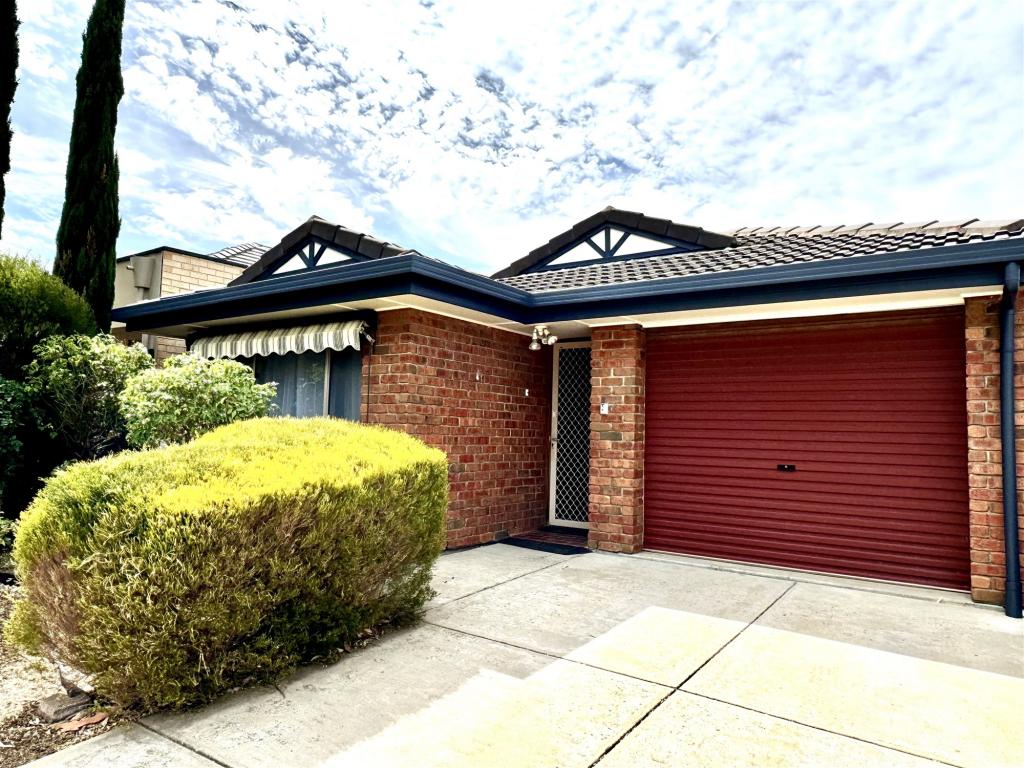 0
0About Manningham 5086
The size of Manningham is approximately 0.6 square kilometres. It has 2 parks covering nearly 4.4% of total area. The population of Manningham in 2011 was 1,295 people. By 2016 the population was 1,308 showing a population growth of 1.0% in the area during that time. The predominant age group in Manningham is 30-39 years. Households in Manningham are primarily couples with children and are likely to be repaying $1800 - $2399 per month on mortgage repayments. In general, people in Manningham work in a professional occupation. In 2011, 74.7% of the homes in Manningham were owner-occupied compared with 72.9% in 2016.
Manningham has 635 properties. Over the last 5 years, Houses in Manningham have seen a 83.66% increase in median value, while Units have seen a 90.58% increase. As at 31 October 2024:
- The median value for Houses in Manningham is $1,025,132 while the median value for Units is $481,451.
- Houses have a median rent of $595 while Units have a median rent of $283.
Suburb Insights for Manningham 5086
Market Insights
Manningham Trends for Houses
N/A
N/A
View TrendN/A
N/A
Manningham Trends for Units
N/A
N/A
View TrendN/A
N/A
Neighbourhood Insights
© Copyright 2024 RP Data Pty Ltd trading as CoreLogic Asia Pacific (CoreLogic). All rights reserved.
This product uses cookies and other similar technologies to improve and customise your browsing experience, to tailor content and adverts, and for analytics and metrics regarding visitor usage on this product and other media. We may share cookie and analytics information with third parties for the purposes of advertising. By continuing to use our website, you consent to cookies being used. View our Privacy Policy here.
X