33 Maubeuge StreetSouth Granville NSW 2142
Property Details for 33 Maubeuge St, South Granville
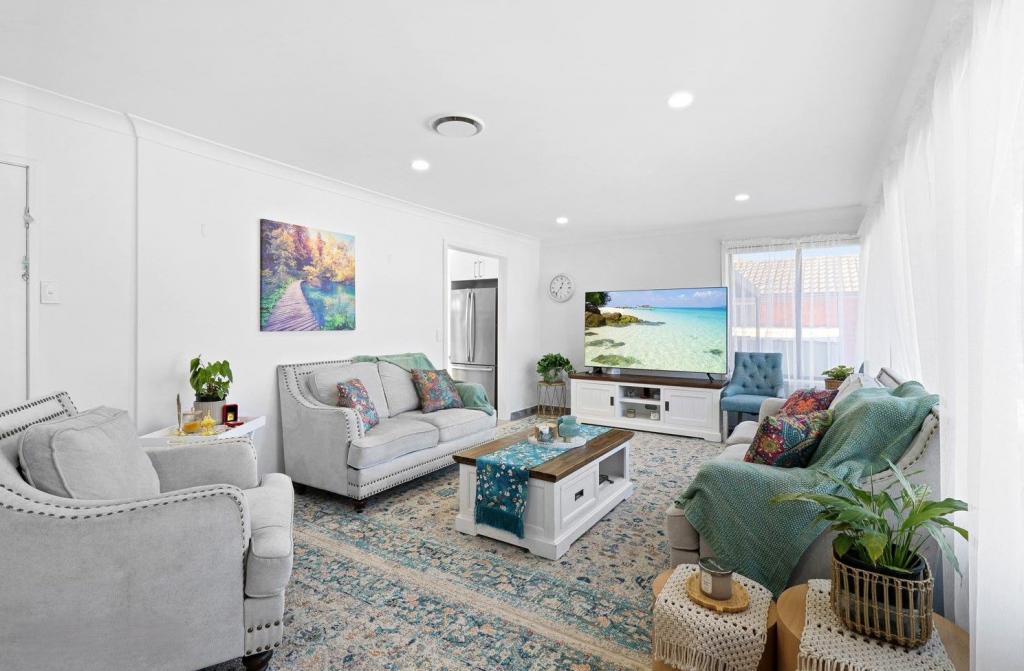
33 Maubeuge St, South Granville is a 3 bedroom, 1 bathroom House with 2 parking spaces and was built in 1950. The property has a land size of 604m2 and floor size of 80m2. While the property is not currently for sale or for rent, it was last sold in June 2024. There are other 3 bedroom House sold in South Granville in the last 12 months.
Last Listing description (October 2024)
This property is positioned perfectly for a convenient lifestyle. Enjoy close proximity to local shops, schools, parks/sport grounds, and public transport.
Don't miss this exciting opportunity - contact us today to arrange an inspection!
Main Features:
** Separate living and dining areas
** Floorboards throughout
Property History for 33 Maubeuge St, South Granville, NSW 2142
- 21 Aug 2024Listed for Rent $700 / week
- 06 Jun 2024Sold for $1,160,000
- 25 Apr 2024Listed for Sale $1,160,000
Commute Calculator
Recent sales nearby
See more recent sales nearby
Similar properties For Sale nearby
See more properties for sale nearby
 0
0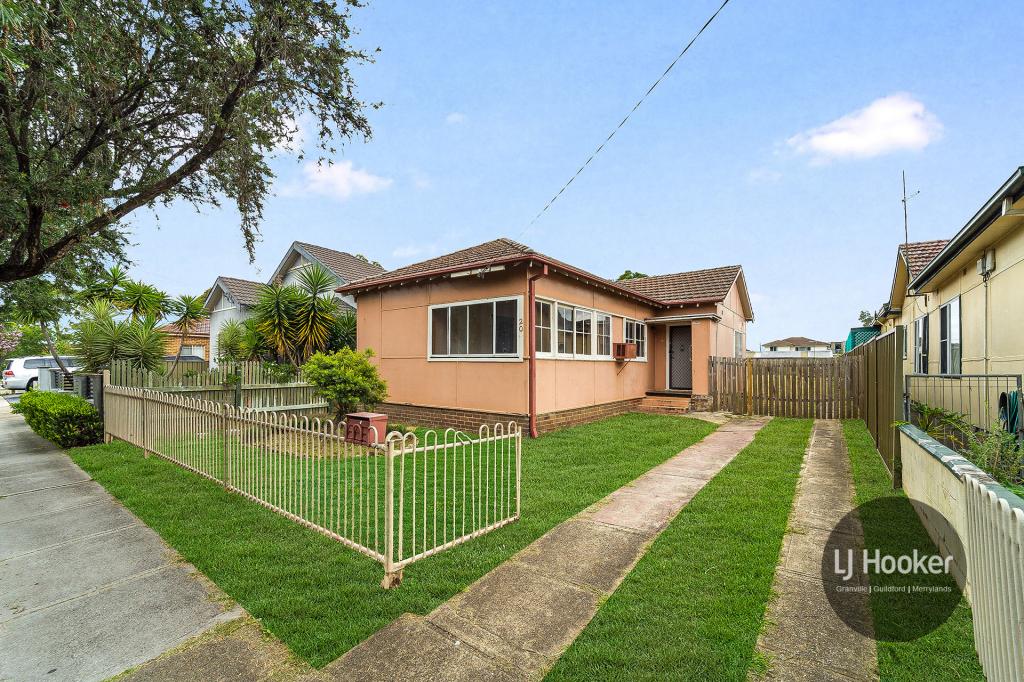 0
0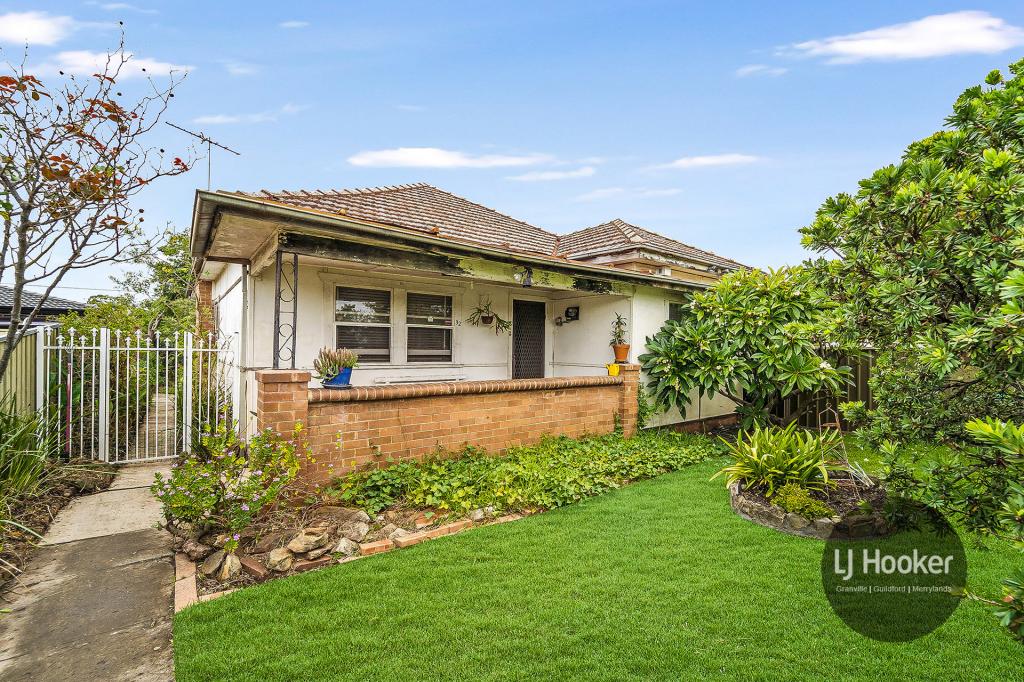 0
0Similar properties For Rent nearby
See more properties for rent nearby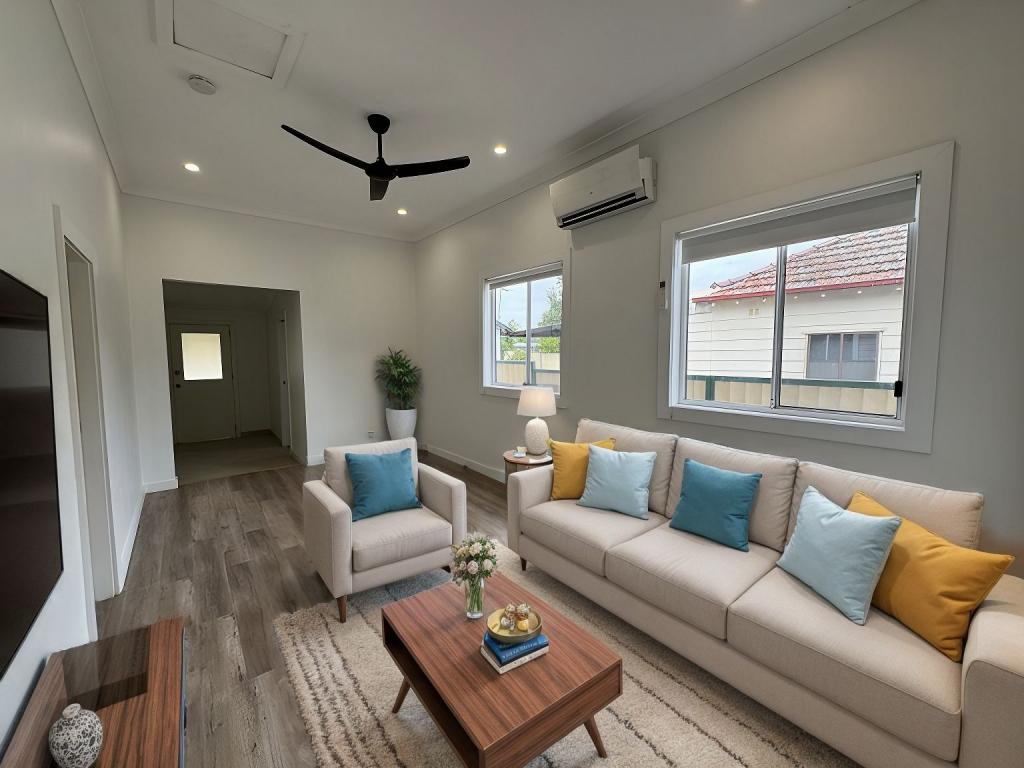 0
0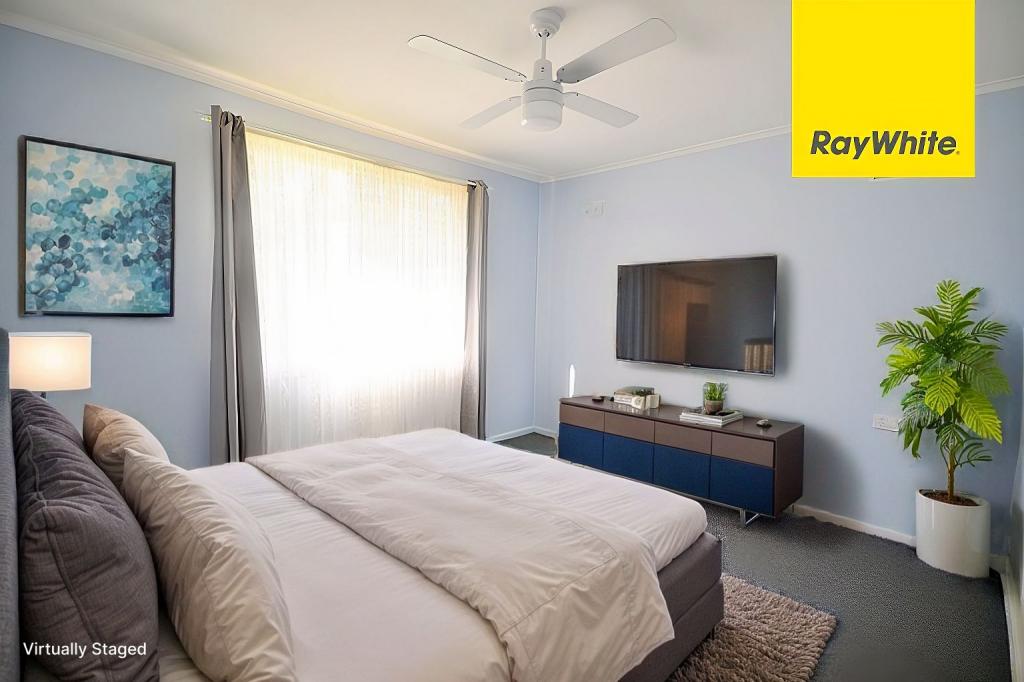 0
0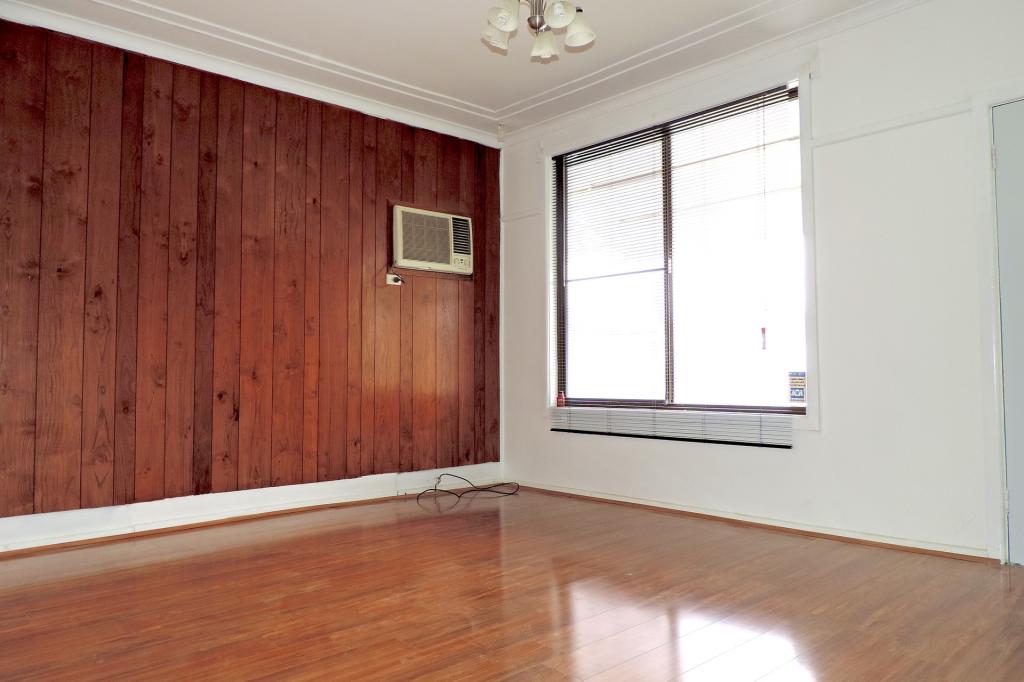 0
0About South Granville 2142
The size of South Granville is approximately 2.2 square kilometres. It has 15 parks covering nearly 20.4% of total area. The population of South Granville in 2011 was 4,852 people. By 2016 the population was 5,485 showing a population growth of 13.0% in the area during that time. The predominant age group in South Granville is 0-9 years. Households in South Granville are primarily couples with children and are likely to be repaying $1800 - $2399 per month on mortgage repayments. In general, people in South Granville work in a trades occupation. In 2011, 48.9% of the homes in South Granville were owner-occupied compared with 46.6% in 2016.
South Granville has 2,170 properties. Over the last 5 years, Houses in South Granville have seen a 56.76% increase in median value, while Units have seen a 19.08% increase. As at 28 February 2025:
- The median value for Houses in South Granville is $1,228,231 while the median value for Units is $676,766.
- Houses have a median rent of $720 while Units have a median rent of $350.
Suburb Insights for South Granville 2142
Market Insights
South Granville Trends for Houses
N/A
N/A
View TrendN/A
N/A
South Granville Trends for Units
N/A
N/A
View TrendN/A
N/A
Neighbourhood Insights
© Copyright 2025 RP Data Pty Ltd trading as CoreLogic Asia Pacific (CoreLogic). All rights reserved.
This product uses cookies and other similar technologies to improve and customise your browsing experience, to tailor content and adverts, and for analytics and metrics regarding visitor usage on this product and other media. We may share cookie and analytics information with third parties for the purposes of advertising. By continuing to use our website, you consent to cookies being used. View our Privacy Policy here.
X