75 Allambi WaySouth Yunderup WA 6208
Property Details for 75 Allambi Way, South Yunderup
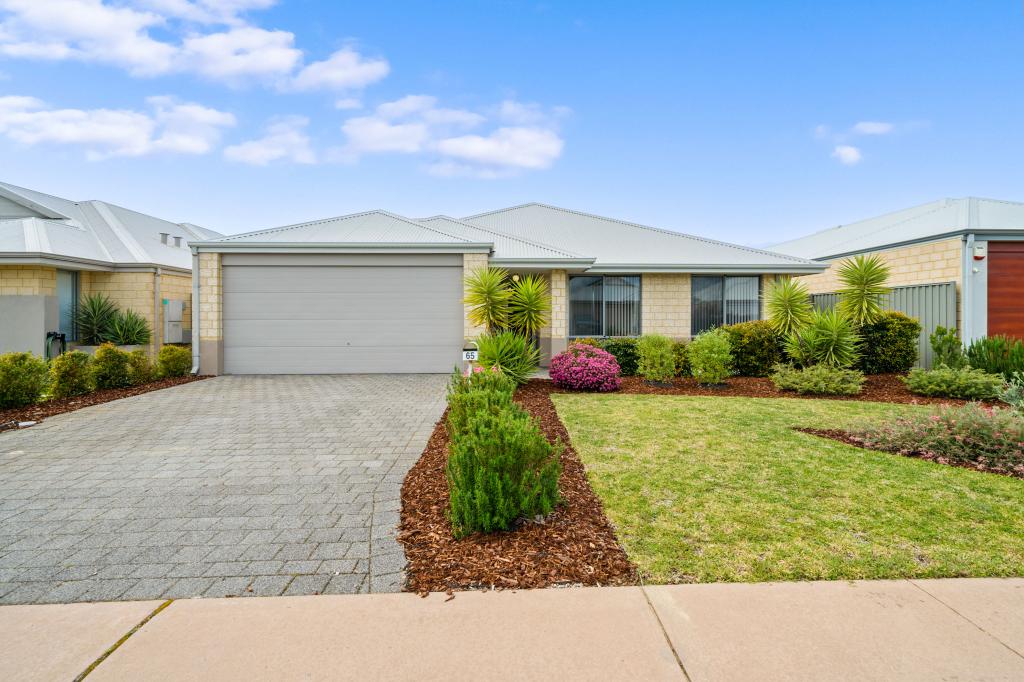
75 Allambi Way, South Yunderup is a 4 bedroom, 1 bathroom House with 2 parking spaces and was built in 1991. The property has a land size of 613m2 and floor size of 158m2. While the property is not currently for sale or for rent, it was last sold in May 2022.
Last Listing description (July 2022)
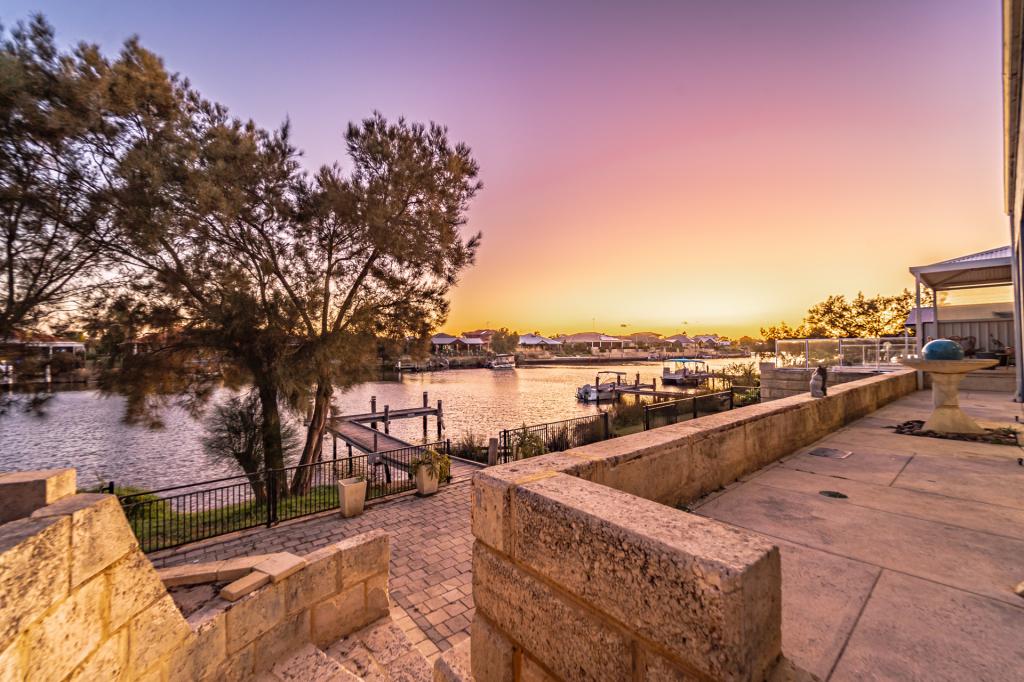
Beautifully presented 4 bedroom, 1 bathroom waterfront home. The spacious open plan kitchen / living zone takes full advantage of its tranquil water views. The home has ducted air conditioning, ceiling fans, tile fire for heating, easy care reticulated gardens, a shed and a boat jetty.Pets negotiable. Available 22/7/22.
Property History for 75 Allambi Way, South Yunderup, WA 6208
- 15 Jul 2022Listed for Rent $525 / week
- 28 May 2022Sold for $640,000
- 20 Apr 2022Listed for Sale From $649,000
Commute Calculator
Recent sales nearby
See more recent sales nearby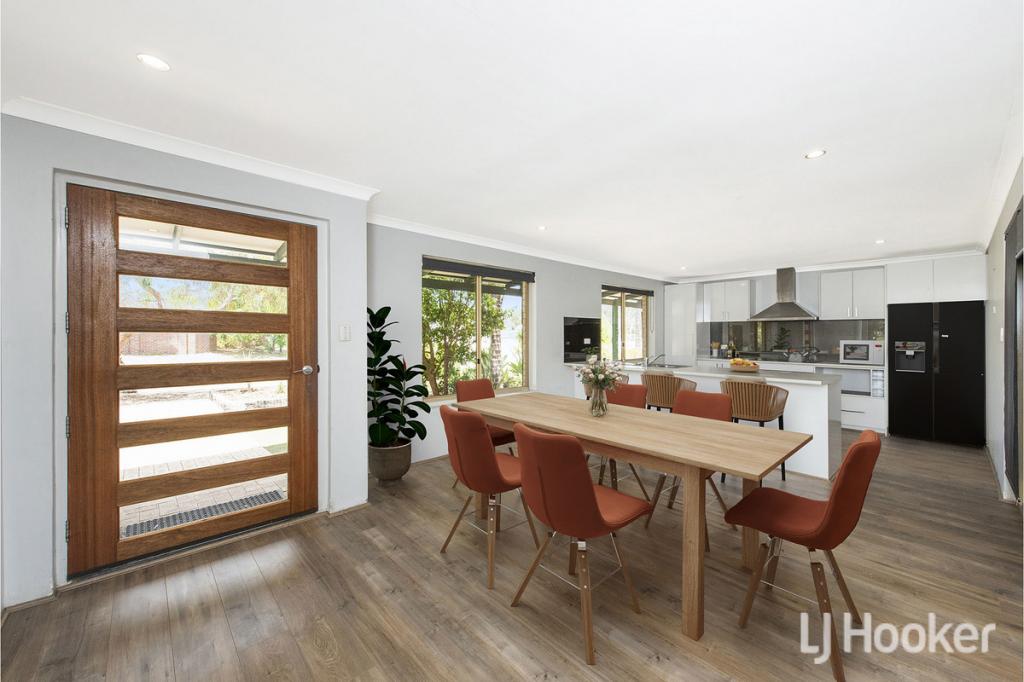 0
0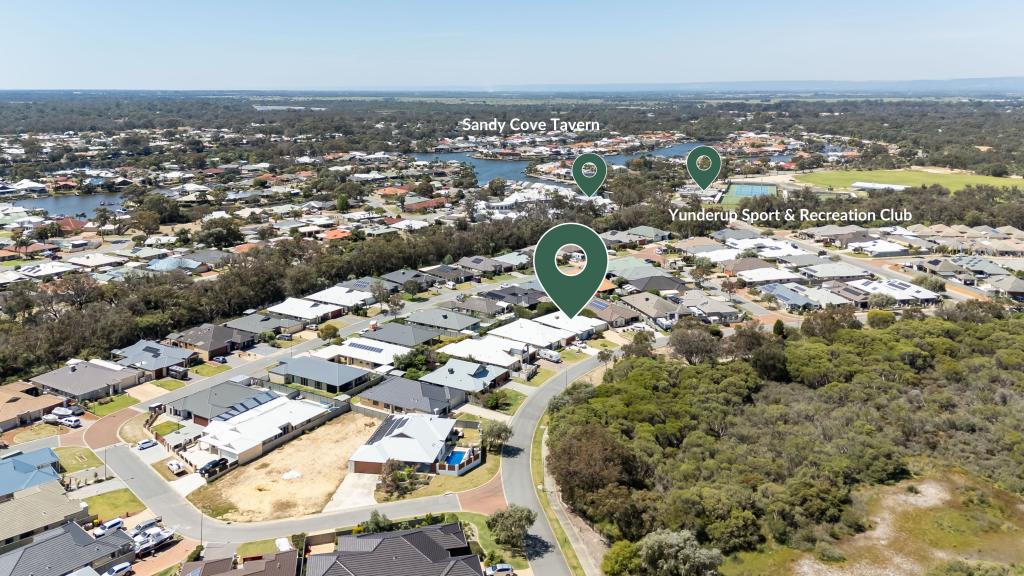 0
0
 0
0Similar properties For Sale nearby
See more properties for sale nearby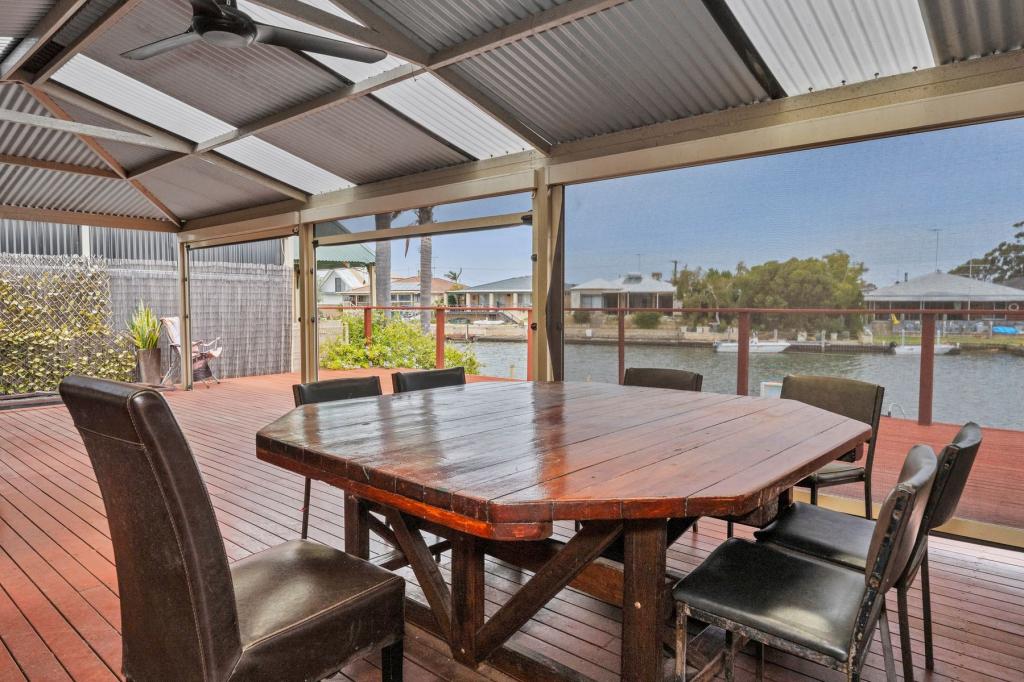 0
0
 0
0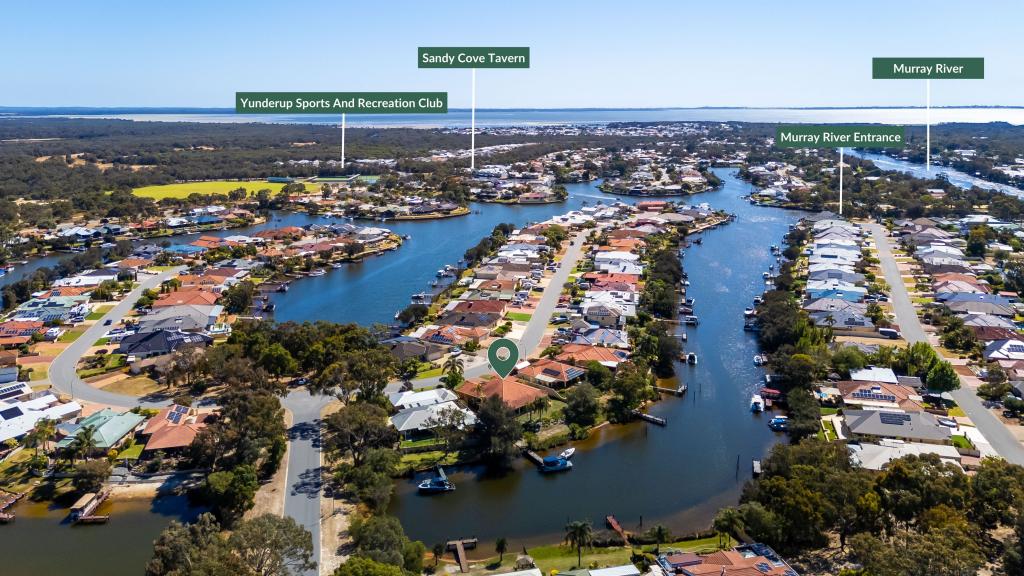 0
0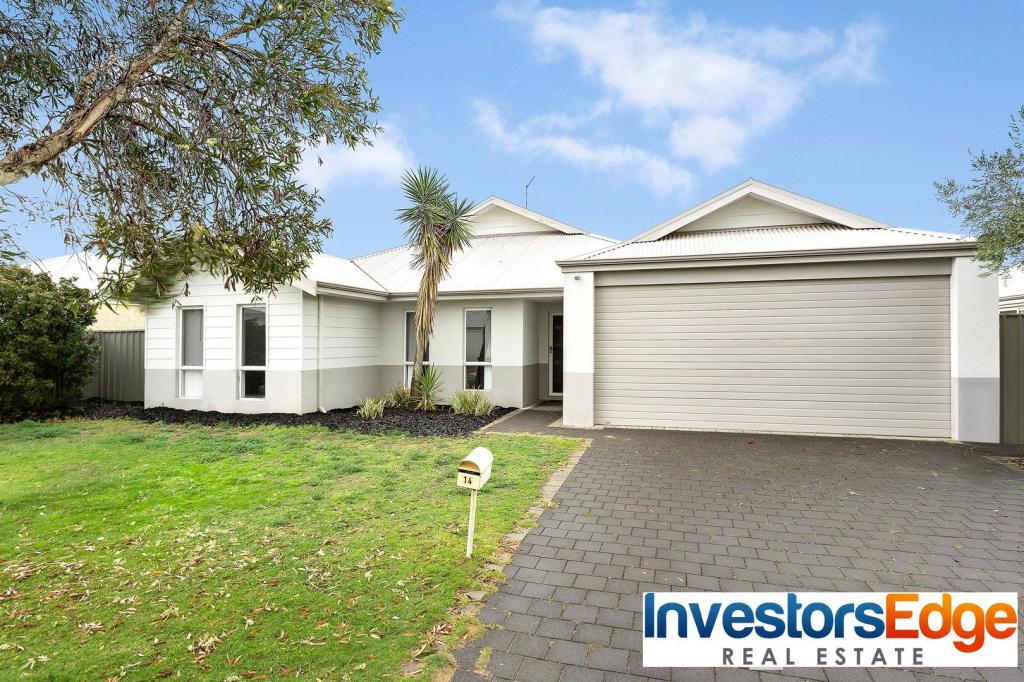 0
0About South Yunderup 6208
The size of South Yunderup is approximately 74 square kilometres. It has 30 parks covering nearly 5% of total area. The population of South Yunderup in 2011 was 2,235 people. By 2016 the population was 3,136 showing a population growth of 40.3% in the area during that time. The predominant age group in South Yunderup is 60-69 years. Households in South Yunderup are primarily childless couples and are likely to be repaying $1800 - $2399 per month on mortgage repayments. In general, people in South Yunderup work in a trades occupation. In 2011, 77.5% of the homes in South Yunderup were owner-occupied compared with 73.6% in 2016.
South Yunderup has 2,974 properties. Over the last 5 years, Houses in South Yunderup have seen a 59.85% increase in median value, while Units have seen a 54.91% increase. As at 30 November 2024:
- The median value for Houses in South Yunderup is $680,417 while the median value for Units is $411,618.
- Houses have a median rent of $580 while Units have a median rent of $450.
Suburb Insights for South Yunderup 6208
Market Insights
South Yunderup Trends for Houses
N/A
N/A
View TrendN/A
N/A
South Yunderup Trends for Units
N/A
N/A
View TrendN/A
N/A
Neighbourhood Insights
© Copyright 2024 RP Data Pty Ltd trading as CoreLogic Asia Pacific (CoreLogic). All rights reserved.
This product uses cookies and other similar technologies to improve and customise your browsing experience, to tailor content and adverts, and for analytics and metrics regarding visitor usage on this product and other media. We may share cookie and analytics information with third parties for the purposes of advertising. By continuing to use our website, you consent to cookies being used. View our Privacy Policy here.
X