9 Lawson StreetSouth Hedland WA 6722
Property Details for 9 Lawson St, South Hedland
9 Lawson St, South Hedland is a 3 bedroom, 1 bathroom House with 1 parking spaces and was built in 1970. The property has a land size of 911m2 and floor size of 87m2. While the property is not currently for sale or for rent, it was last sold in August 2020.
Last Listing description (October 2022)
Positioned within walking distance to the South Hedland CBD, you have easy and quick access to all the fine eateries, medical centres, sporting facilities and leisure activities that South Hedland has to offer.
Features include:
Three bedrooms
Fully fenced + low maintenance
Enough room for 4 cars, boat & caravans
Tiled living areas, carpet to bedrooms
Fully air conditioned + ceiling fans
24m2 shed
Cracker dust to majority of yard
Car access both sides of house
Property History for 9 Lawson St, South Hedland, WA 6722
- 21 Sep 2022Listed for Rent - Price not available
- 19 Jan 2021Listed for Rent $300 / week
- 11 Aug 2020Sold for $199,000
Commute Calculator
Recent sales nearby
See more recent sales nearbySimilar properties For Sale nearby
See more properties for sale nearby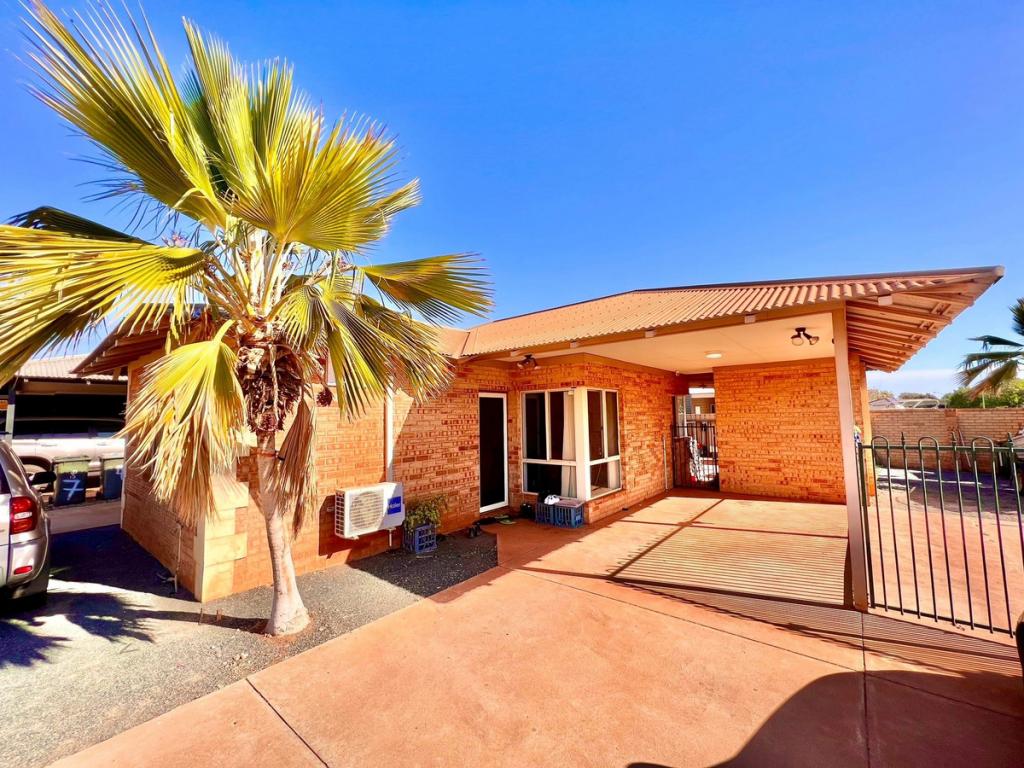 0
0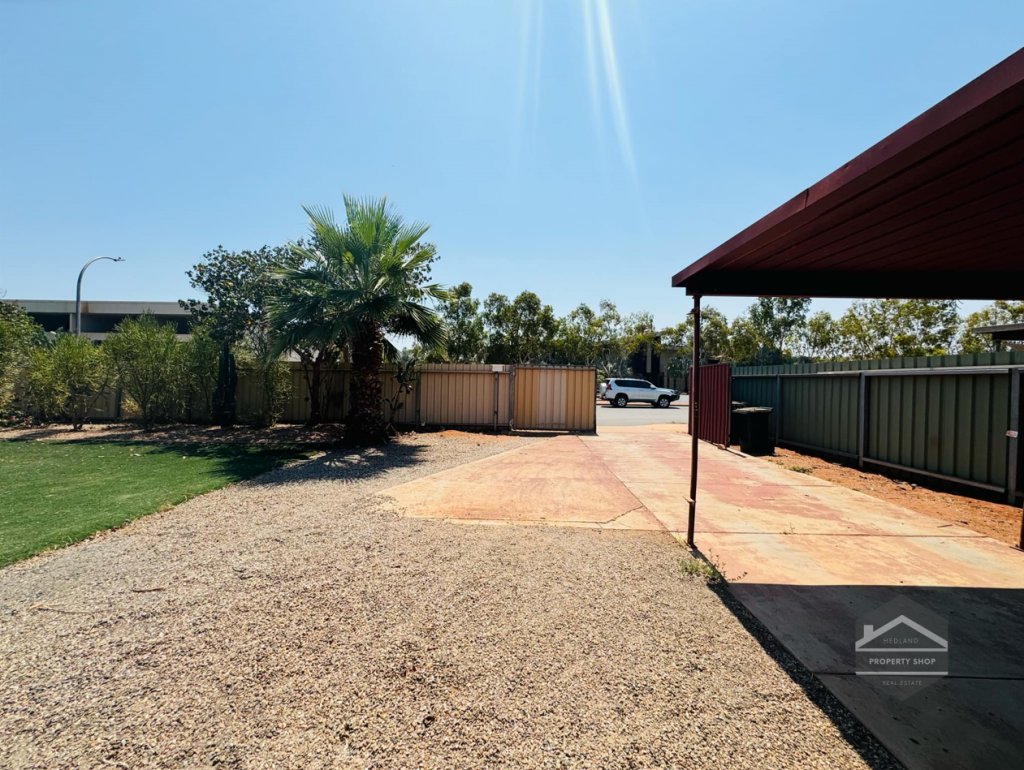 0
0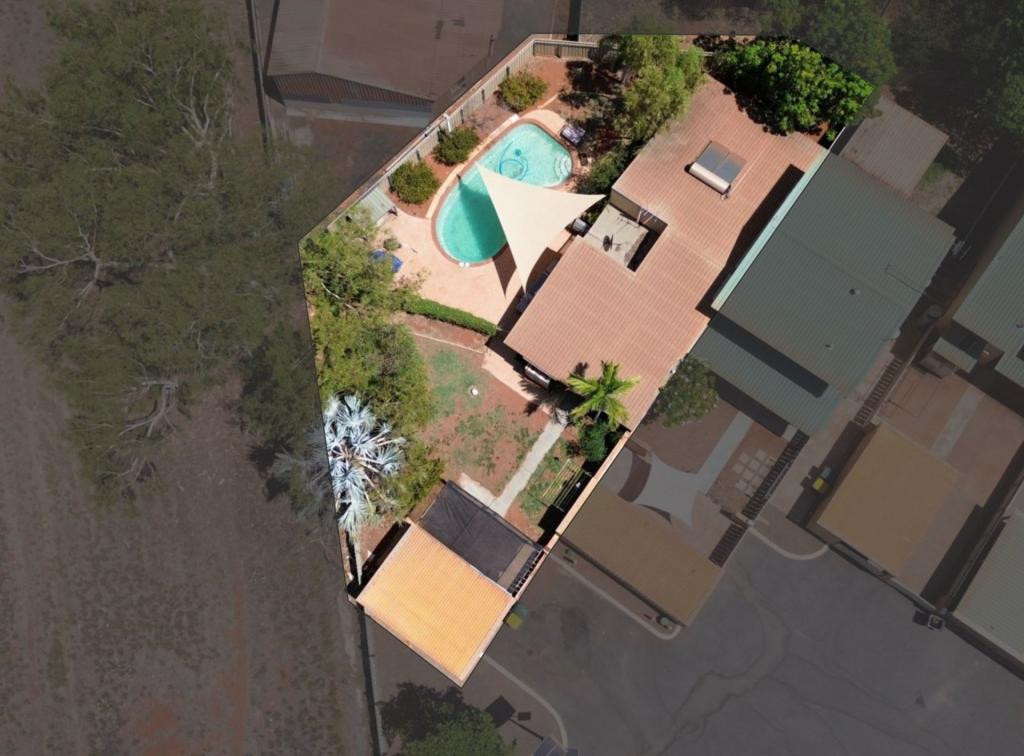 0
0Similar properties For Rent nearby
See more properties for rent nearby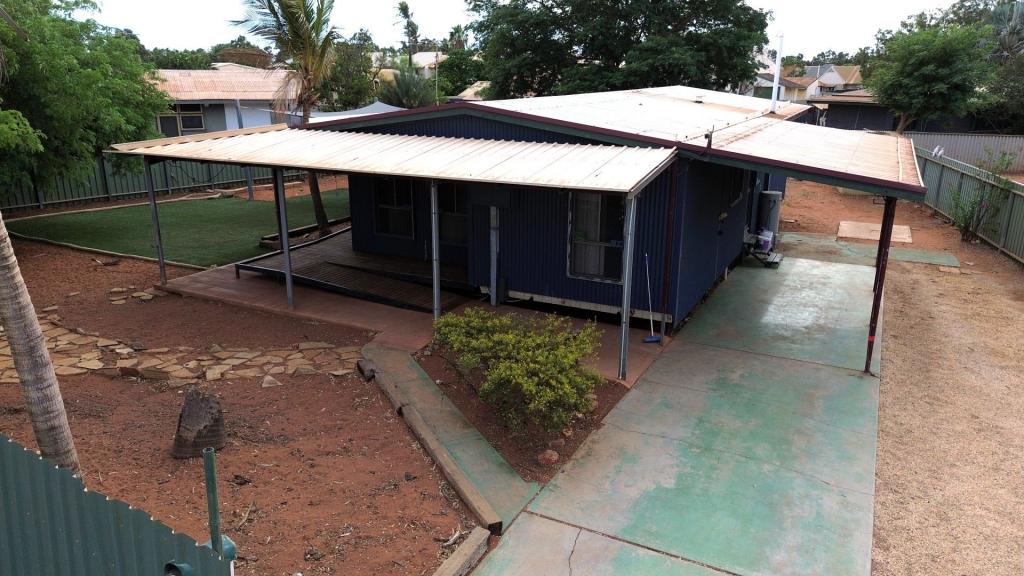 0
0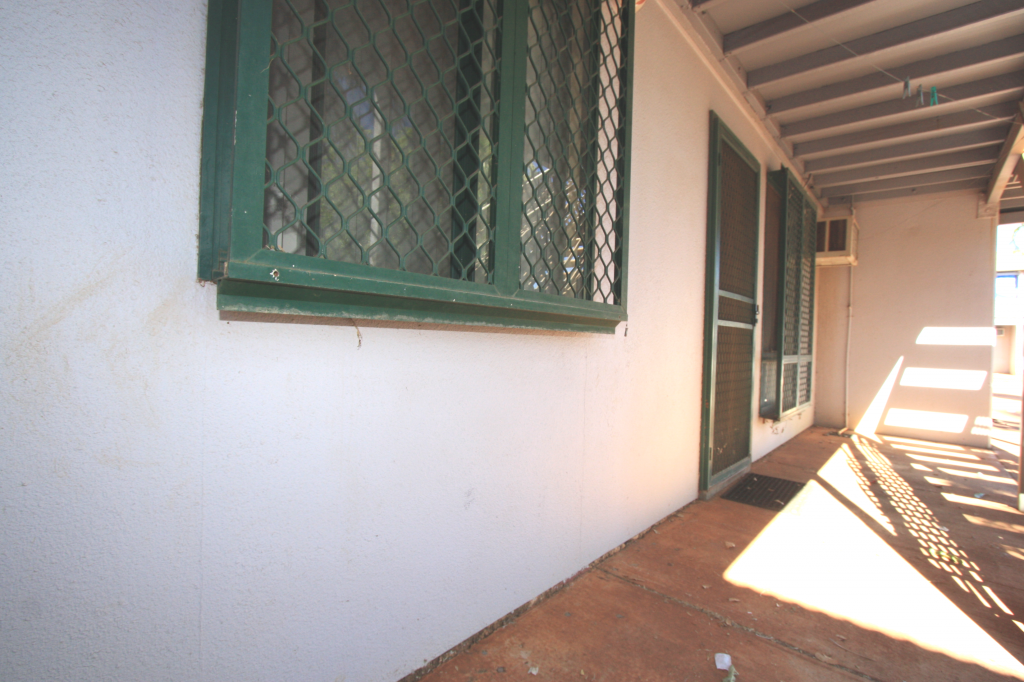 0
0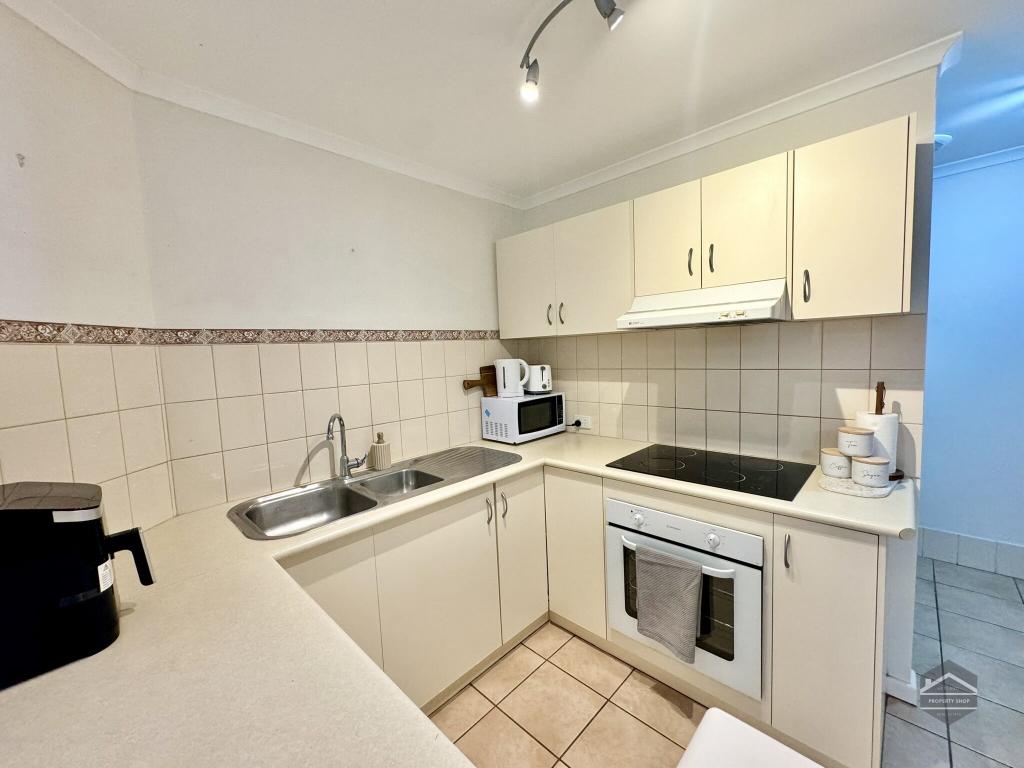 0
0About South Hedland 6722
The size of South Hedland is approximately 22.8 square kilometres. It has 8 parks covering nearly 5.3% of total area. The population of South Hedland in 2011 was 9,376 people. By 2016 the population was 9,475 showing a population growth of 1.1% in the area during that time. The predominant age group in South Hedland is 30-39 years. Households in South Hedland are primarily couples with children and are likely to be repaying $3000 - $3999 per month on mortgage repayments. In general, people in South Hedland work in a trades occupation. In 2011, 28.5% of the homes in South Hedland were owner-occupied compared with 16.8% in 2016.
South Hedland has 5,274 properties. Over the last 5 years, Houses in South Hedland have seen a 125.41% increase in median value, while Units have seen a 153.84% increase. As at 31 October 2024:
- The median value for Houses in South Hedland is $442,153 while the median value for Units is $303,903.
- Houses have a median rent of $950 while Units have a median rent of $720.
Suburb Insights for South Hedland 6722
Market Insights
South Hedland Trends for Houses
N/A
N/A
View TrendN/A
N/A
South Hedland Trends for Units
N/A
N/A
View TrendN/A
N/A
Neighbourhood Insights
© Copyright 2024 RP Data Pty Ltd trading as CoreLogic Asia Pacific (CoreLogic). All rights reserved.
This product uses cookies and other similar technologies to improve and customise your browsing experience, to tailor content and adverts, and for analytics and metrics regarding visitor usage on this product and other media. We may share cookie and analytics information with third parties for the purposes of advertising. By continuing to use our website, you consent to cookies being used. View our Privacy Policy here.
X