8 Goldsmith StreetSouth Bunbury WA 6230
Property Details for 8 Goldsmith St, South Bunbury
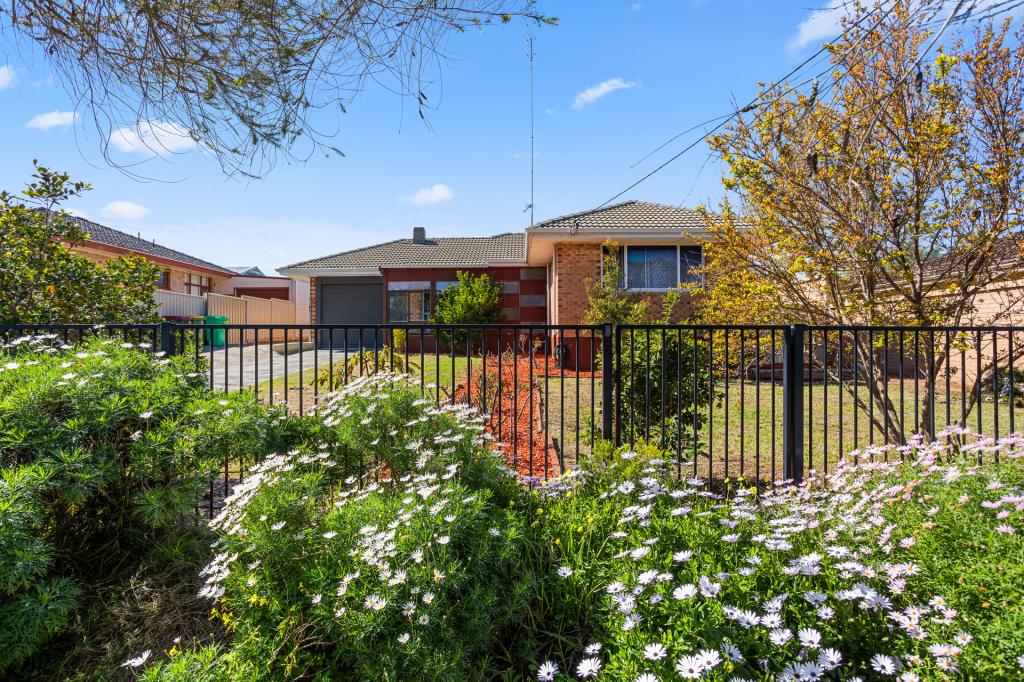
8 Goldsmith St, South Bunbury is a 3 bedroom, 1 bathroom House with 1 parking spaces and was built in 1964. The property has a land size of 501m2 and floor size of 1m2. While the property is not currently for sale or for rent, it was last sold in September 2020.
Last Listing description (March 2018)
SOUTH BUNBURY LARGE SHED!!
This lovely 3 bedroom duplex is set on a large low maintenance block with side access and large shed.
Features include
- 1 Bathroom
- Open plan lounge, dining, kitchen
- Polished timber floors
- Reverse cycle air-conditioning
- Great alfresco area
- Side access to large colour-bond shed
- Lawnmowing included
$330 per week. Available 08/07/17. Pets Considered. Call RentPro Property to arrange a viewing on
0422 314 634
Property History for 8 Goldsmith St, South Bunbury, WA 6230
- 21 Sep 2020Sold for $337,000
- 13 Mar 2018Listed for Rent $330 / week
- 29 May 2017Listed for Rent - Price not available
Commute Calculator
Recent sales nearby
See more recent sales nearby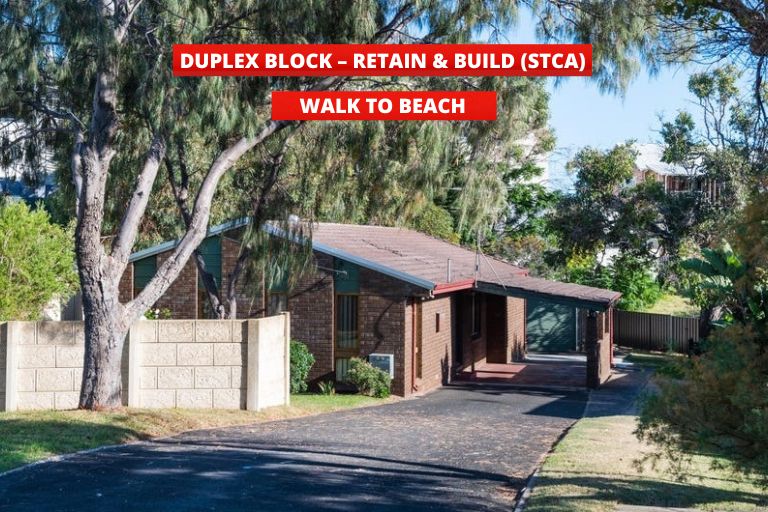 0
0Similar properties For Sale nearby
See more properties for sale nearby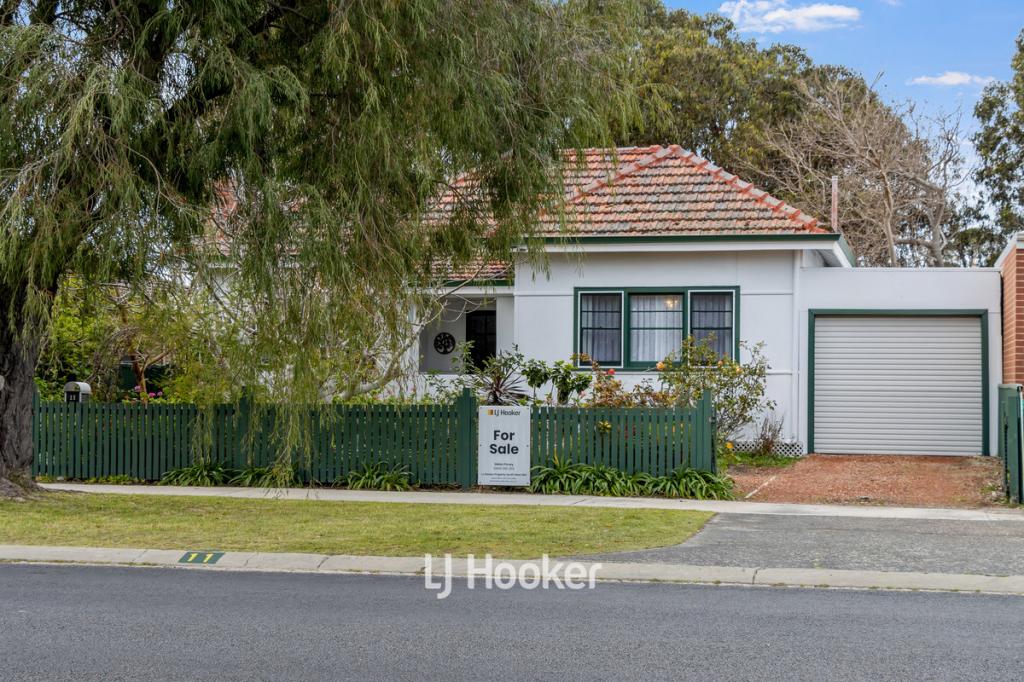 0
0

 0
0
 0
0Similar properties For Rent nearby
See more properties for rent nearby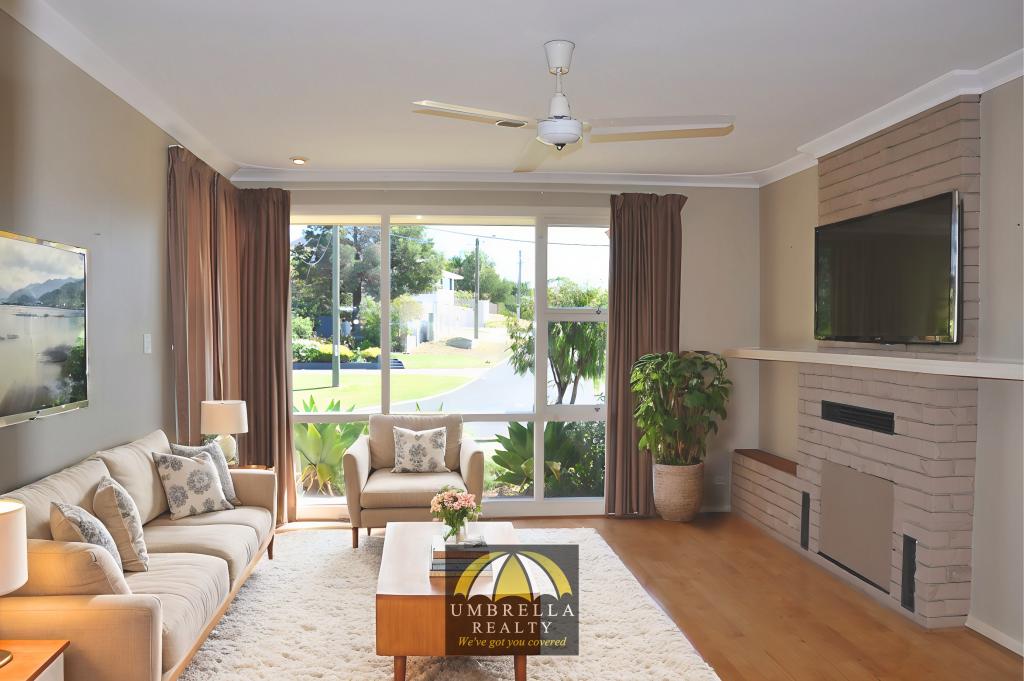 0
0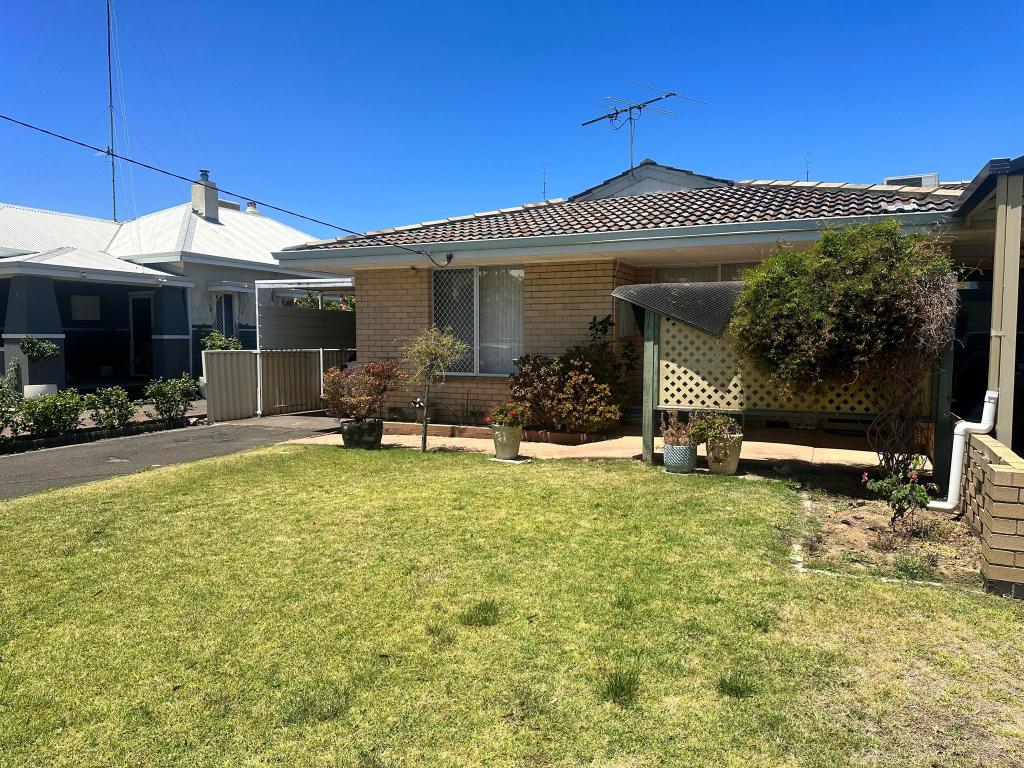 0
0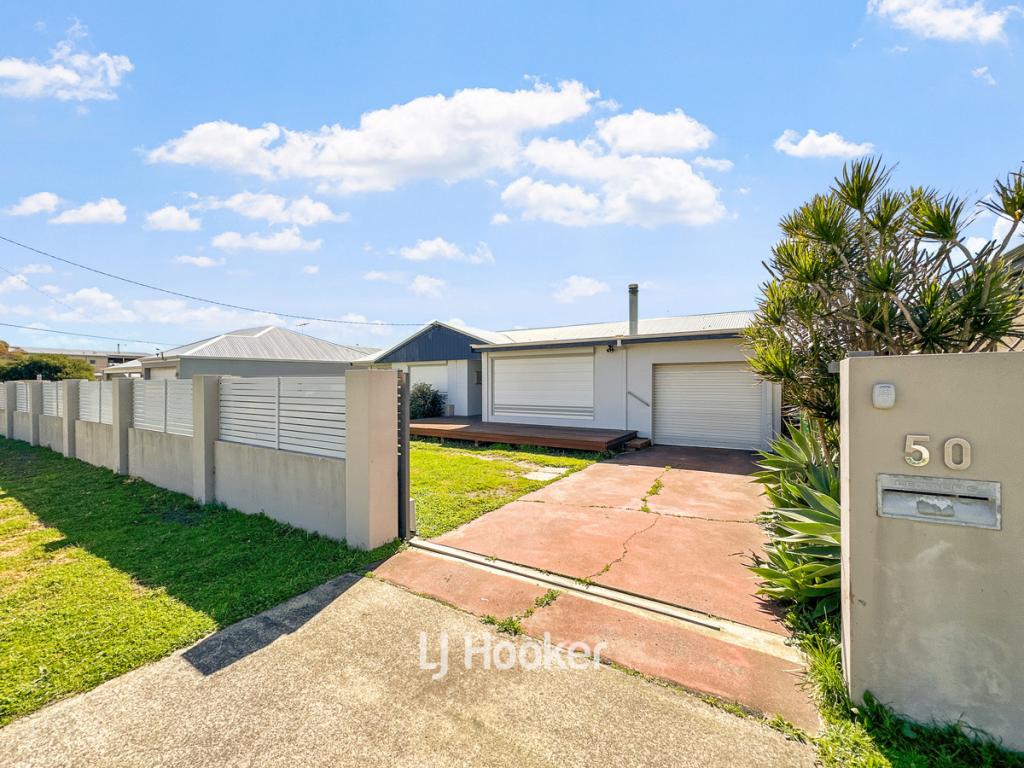 0
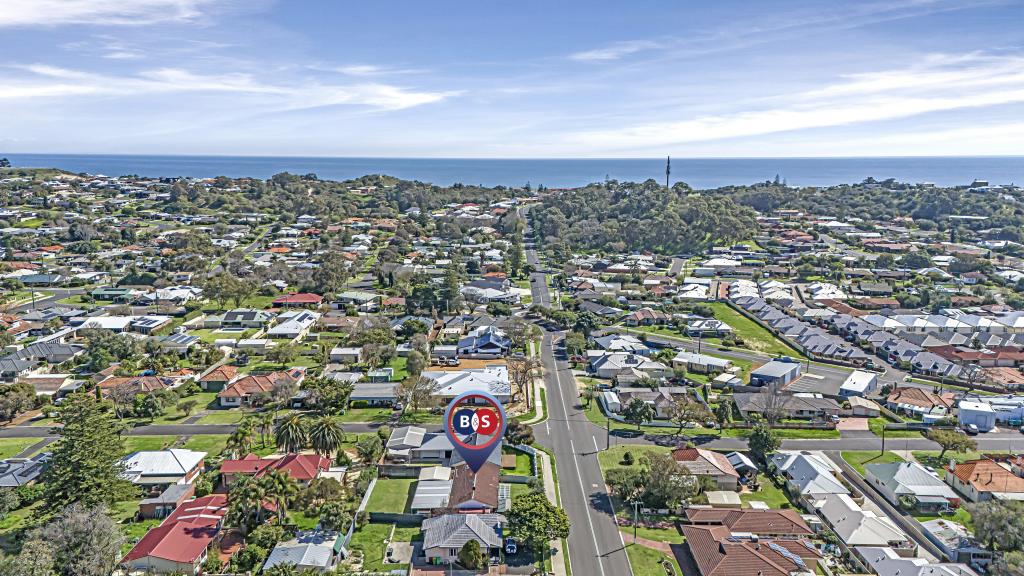
0About South Bunbury 6230
The size of South Bunbury is approximately 6.5 square kilometres. It has 15 parks covering nearly 20.7% of total area. The population of South Bunbury in 2011 was 8,173 people. By 2016 the population was 8,418 showing a population growth of 3.0% in the area during that time. The predominant age group in South Bunbury is 50-59 years. Households in South Bunbury are primarily childless couples and are likely to be repaying $1800 - $2399 per month on mortgage repayments. In general, people in South Bunbury work in a professional occupation. In 2011, 63.3% of the homes in South Bunbury were owner-occupied compared with 63.9% in 2016.
South Bunbury has 4,935 properties. Over the last 5 years, Houses in South Bunbury have seen a 65.11% increase in median value, while Units have seen a 99.00% increase. As at 31 August 2024:
- The median value for Houses in South Bunbury is $639,747 while the median value for Units is $477,216.
- Houses have a median rent of $580 while Units have a median rent of $500.
Suburb Insights for South Bunbury 6230
Market Insights
South Bunbury Trends for Houses
N/A
N/A
View TrendN/A
N/A
South Bunbury Trends for Units
N/A
N/A
View TrendN/A
N/A
Neighbourhood Insights
© Copyright 2024 RP Data Pty Ltd trading as CoreLogic Asia Pacific (CoreLogic). All rights reserved.
This product uses cookies and other similar technologies to improve and customise your browsing experience, to tailor content and adverts, and for analytics and metrics regarding visitor usage on this product and other media. We may share cookie and analytics information with third parties for the purposes of advertising. By continuing to use our website, you consent to cookies being used. View our Privacy Policy here.
X