43A Clarke StreetSouth Bunbury WA 6230
Property Details for 43a Clarke St, South Bunbury
43a Clarke St, South Bunbury is a 3 bedroom, 2 bathroom Townhouse with 2 parking spaces and was built in 2013. The property has a land size of 359m2 and floor size of 128m2. While the property is not currently for sale or for rent, it was last sold in March 2024. There are other 3 bedroom Townhouse sold in South Bunbury in the last 12 months.
Last Listing description (May 2024)
This modern standalone unit is in a great community close to the beach and city centre!No common walls with neighbours and as big as a house, this 3 x 2 home is spacious and well maintained.Features include:- Large open living area with split system air conditioning- Stylish kitchen with stone bench & 900mm oven- Separate lounge room- Big master bedroom with walk in robes and ensuite- Second bedroom with robe and access to semi-ensuite- Third bedroom with robe- Alfresco- Secure yard with garden shedBe quick to call Paul about this great property in the heart of South Bunbury!
Property History for 43a Clarke St, South Bunbury, WA 6230
- 06 Mar 2024Sold for $470,000
- 16 Feb 2024Listed for Sale Offers Over $469,000
- 08 May 2023Listed for Rent $500 / week
Commute Calculator
Recent sales nearby
See more recent sales nearby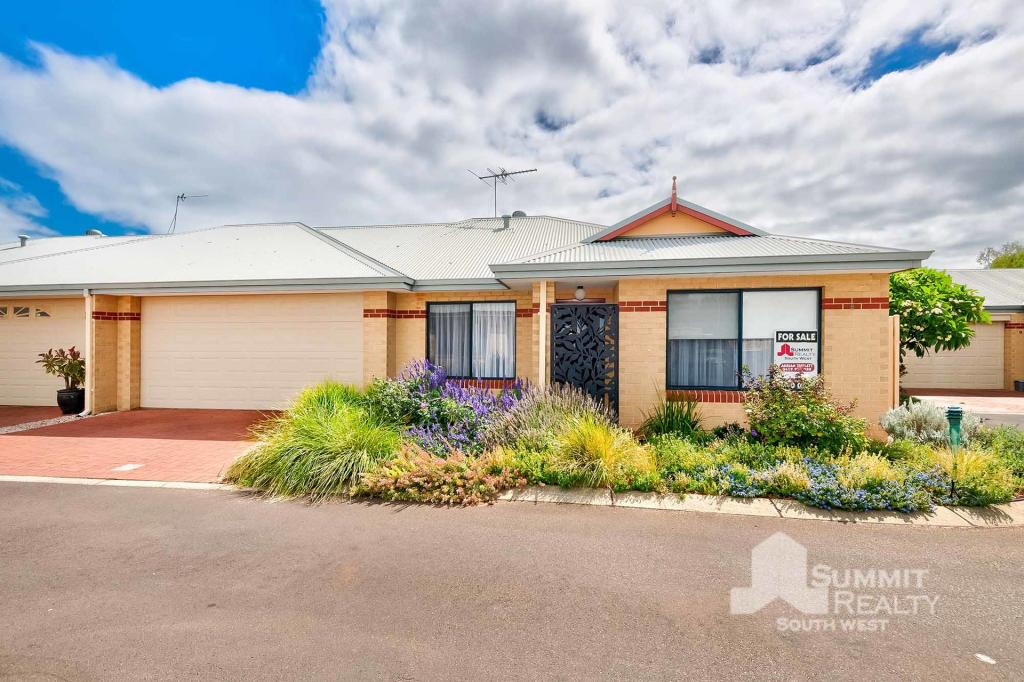 0
0 0
0
Similar properties For Sale nearby
See more properties for sale nearby
 0
0
 0
0 0
0Similar properties For Rent nearby
See more properties for rent nearby 0
0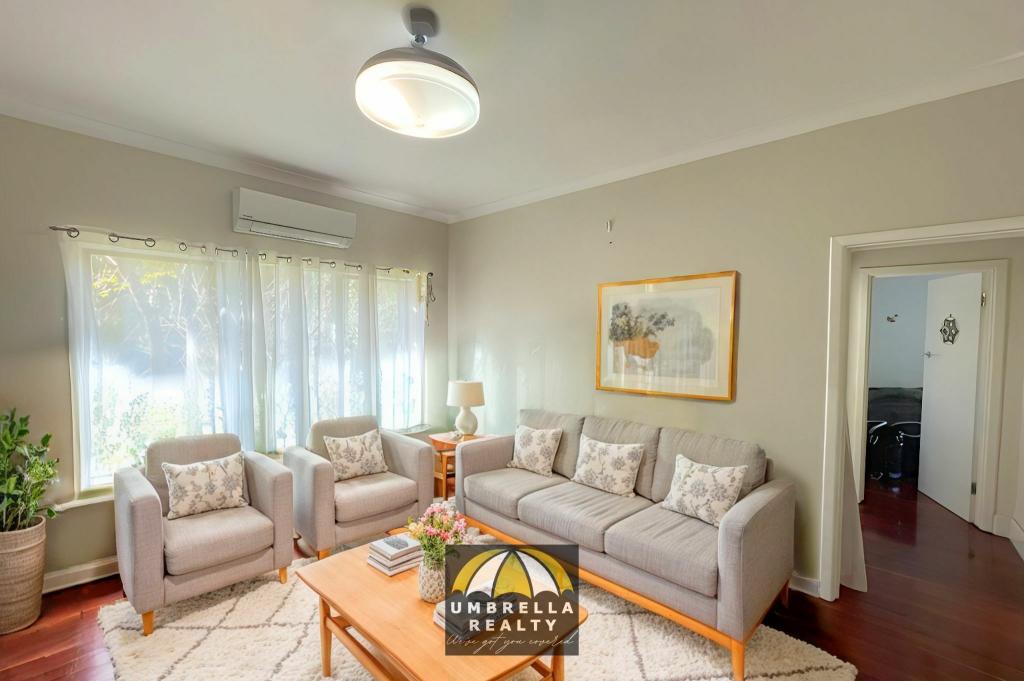 0
0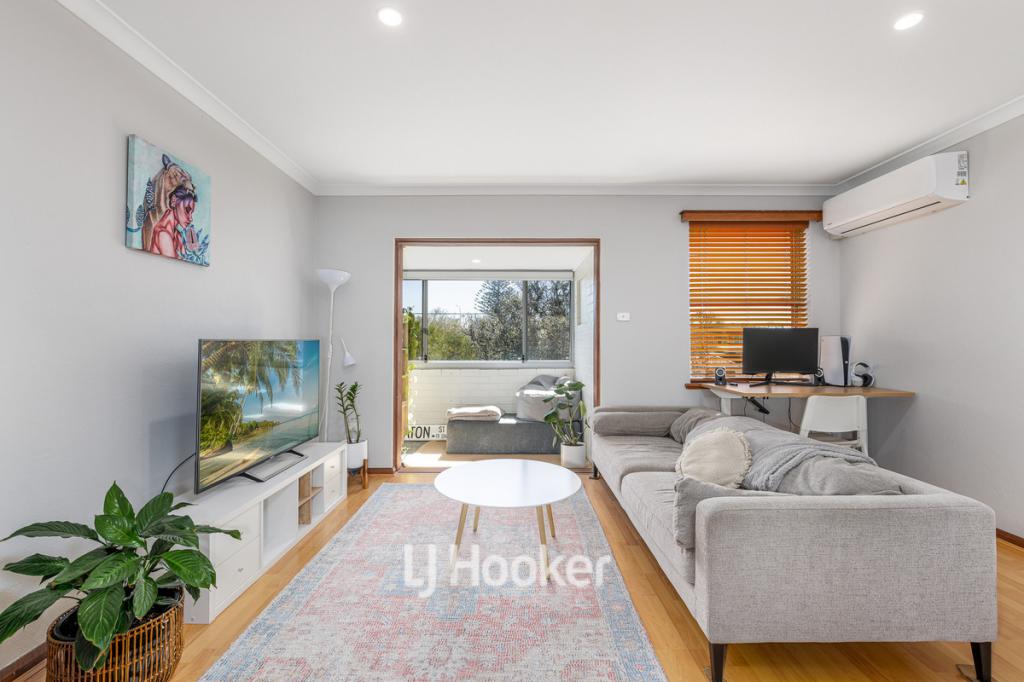 0
0About South Bunbury 6230
The size of South Bunbury is approximately 6.5 square kilometres. It has 15 parks covering nearly 20.7% of total area. The population of South Bunbury in 2011 was 8,173 people. By 2016 the population was 8,418 showing a population growth of 3.0% in the area during that time. The predominant age group in South Bunbury is 50-59 years. Households in South Bunbury are primarily childless couples and are likely to be repaying $1800 - $2399 per month on mortgage repayments. In general, people in South Bunbury work in a professional occupation. In 2011, 63.3% of the homes in South Bunbury were owner-occupied compared with 63.9% in 2016.
South Bunbury has 4,936 properties. Over the last 5 years, Houses in South Bunbury have seen a 68.41% increase in median value, while Units have seen a 117.10% increase. As at 31 October 2024:
- The median value for Houses in South Bunbury is $645,416 while the median value for Units is $505,598.
- Houses have a median rent of $580 while Units have a median rent of $500.
Suburb Insights for South Bunbury 6230
Market Insights
South Bunbury Trends for Houses
N/A
N/A
View TrendN/A
N/A
South Bunbury Trends for Units
N/A
N/A
View TrendN/A
N/A
Neighbourhood Insights
© Copyright 2024 RP Data Pty Ltd trading as CoreLogic Asia Pacific (CoreLogic). All rights reserved.
This product uses cookies and other similar technologies to improve and customise your browsing experience, to tailor content and adverts, and for analytics and metrics regarding visitor usage on this product and other media. We may share cookie and analytics information with third parties for the purposes of advertising. By continuing to use our website, you consent to cookies being used. View our Privacy Policy here.
X