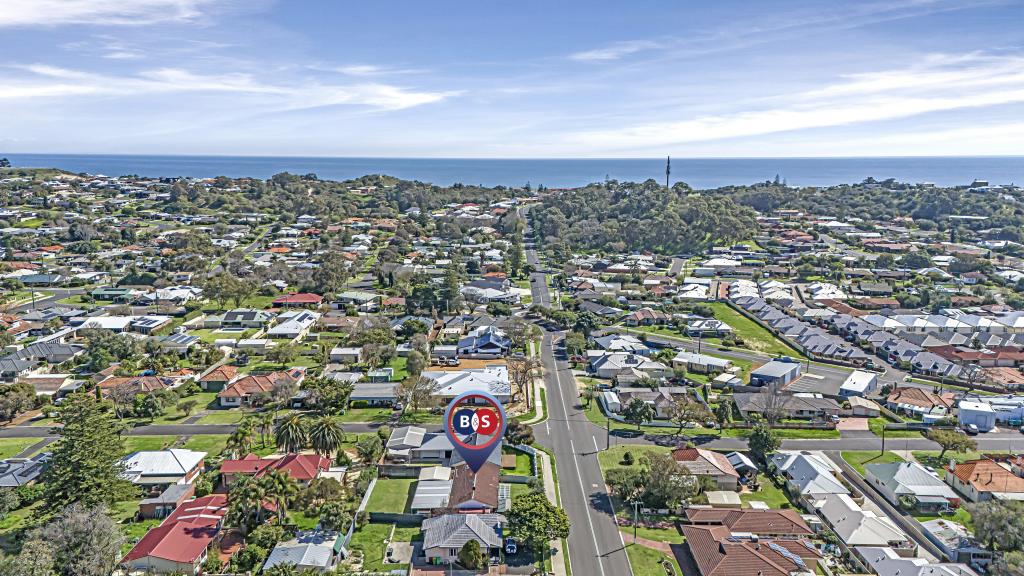
4/110 Mangles StreetSouth Bunbury WA 6230
Property Details for 4/110 Mangles St, South Bunbury
4/110 Mangles St, South Bunbury is a 3 bedroom, 1 bathroom Townhouse with 1 parking spaces and was built in 1994. The property has a land size of 385m2 and floor size of 115m2. While the property is not currently for sale or for rent, it was last sold in April 2024. There are other 3 bedroom Townhouse sold in South Bunbury in the last 12 months.
Last Listing description (July 2024)
Villa 4/110 Mangles Street, in the much sought after suburb of South Bunbury, is beautifully presented and ideally located in the 6-unit complex.
Boasting a generous block size of 385m2 this property has space all around.
The pictures tell the story of the spacious open plan living design, ample sized kitchen and roomy outdoor living area.
This property is ideally suited to those looking for a low maintenance home, or the first home buyer, or to the clever investor looking to take advantage of the very strong rental market.
The only way to appreciate this little gem is to contact us today to arrange a viewing appointment.
Property History for 4/110 Mangles St, South Bunbury, WA 6230
- 15 Apr 2024Sold for $465,000
- 01 Apr 2024Listed for Sale Not Disclosed
Commute Calculator
Recent sales nearby
See more recent sales nearby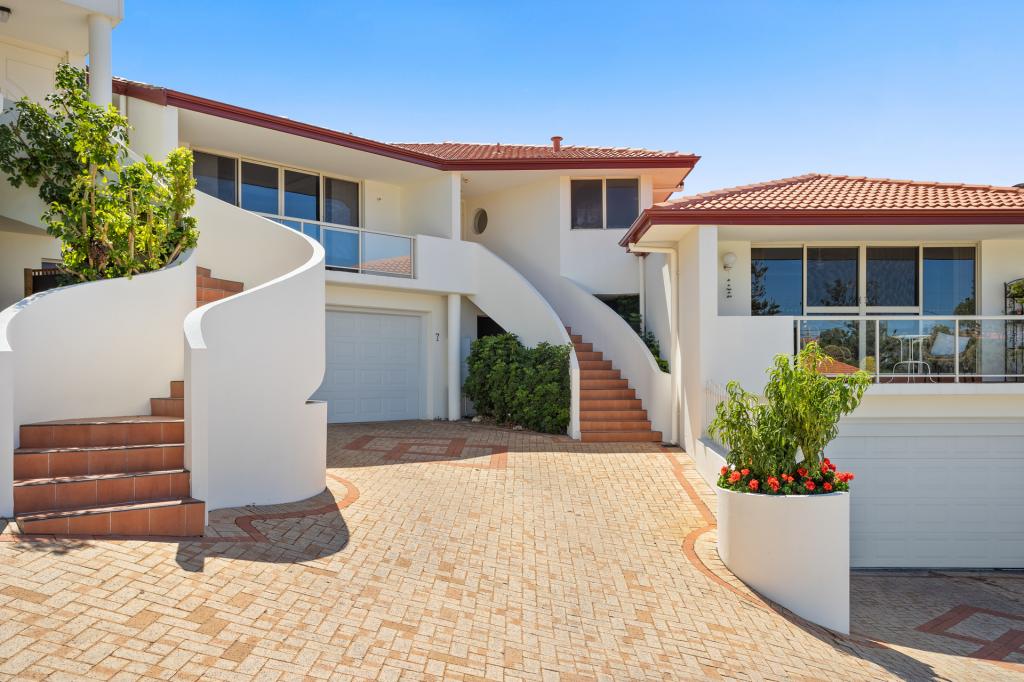 0
0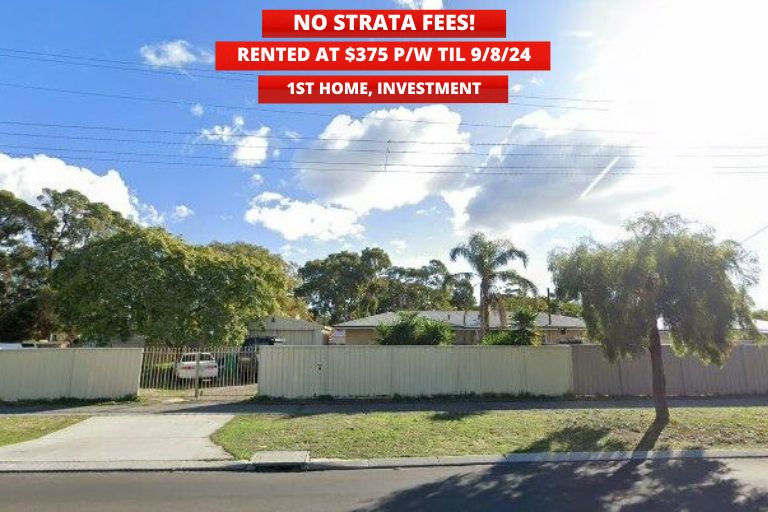 0
0Similar properties For Sale nearby
See more properties for sale nearby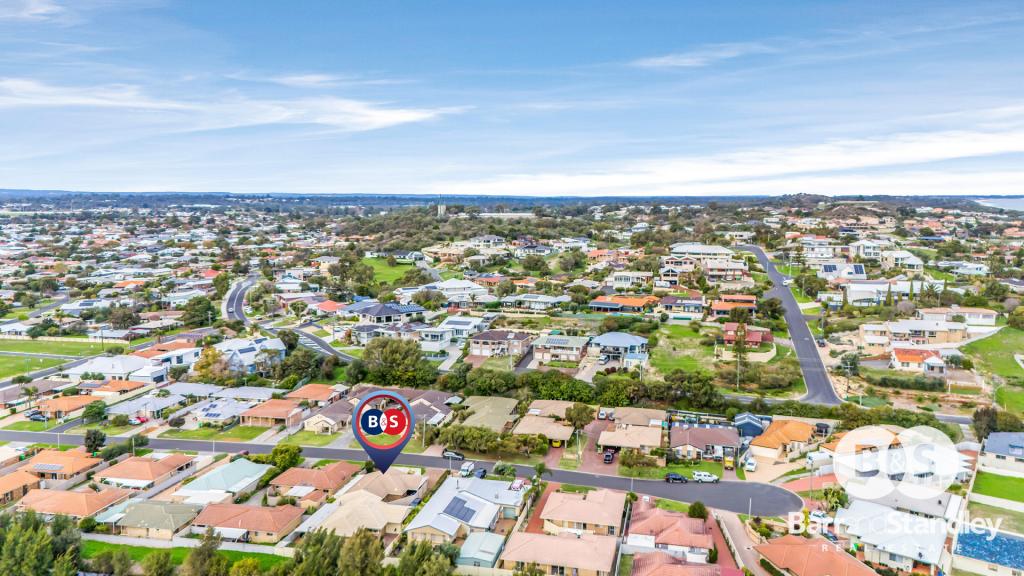 0
0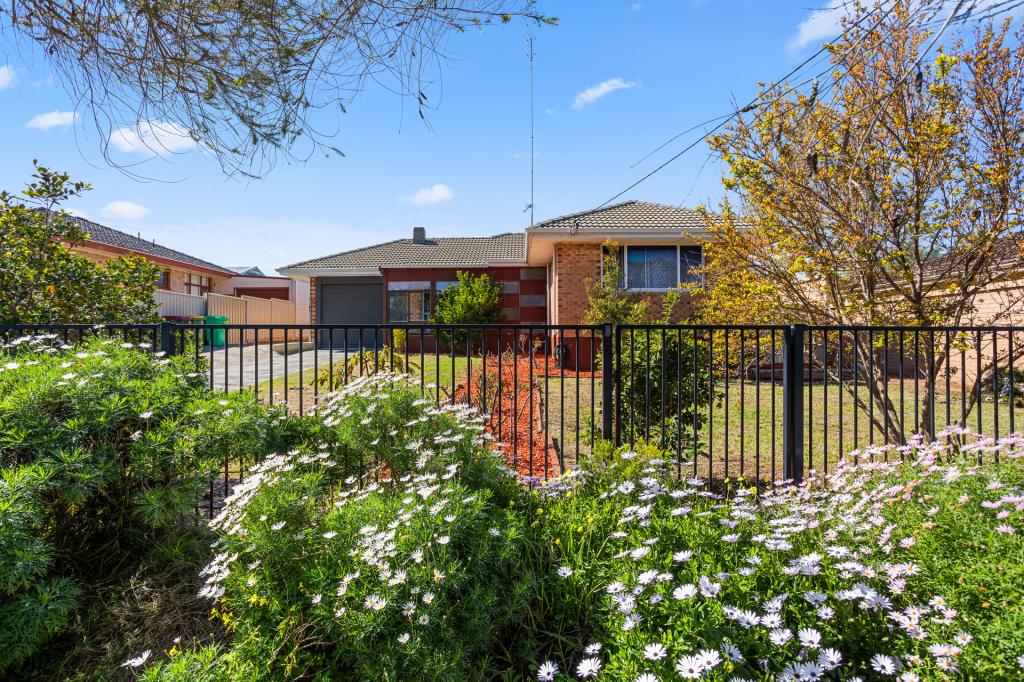 0
0
 0
0
Similar properties For Rent nearby
See more properties for rent nearby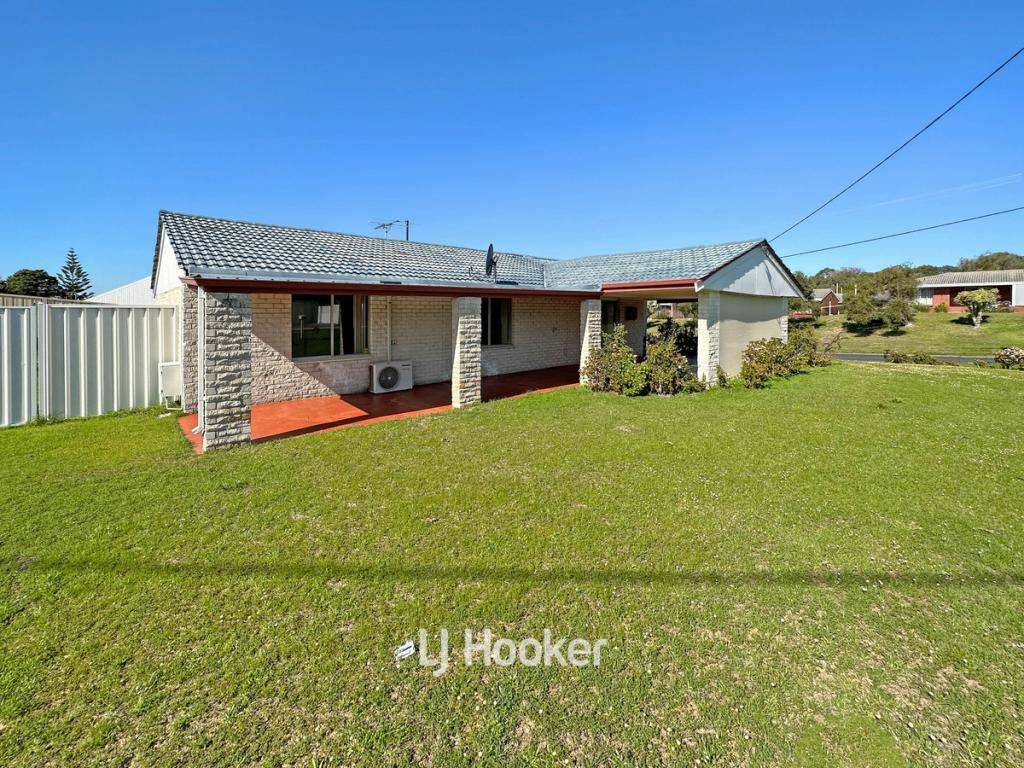 0
0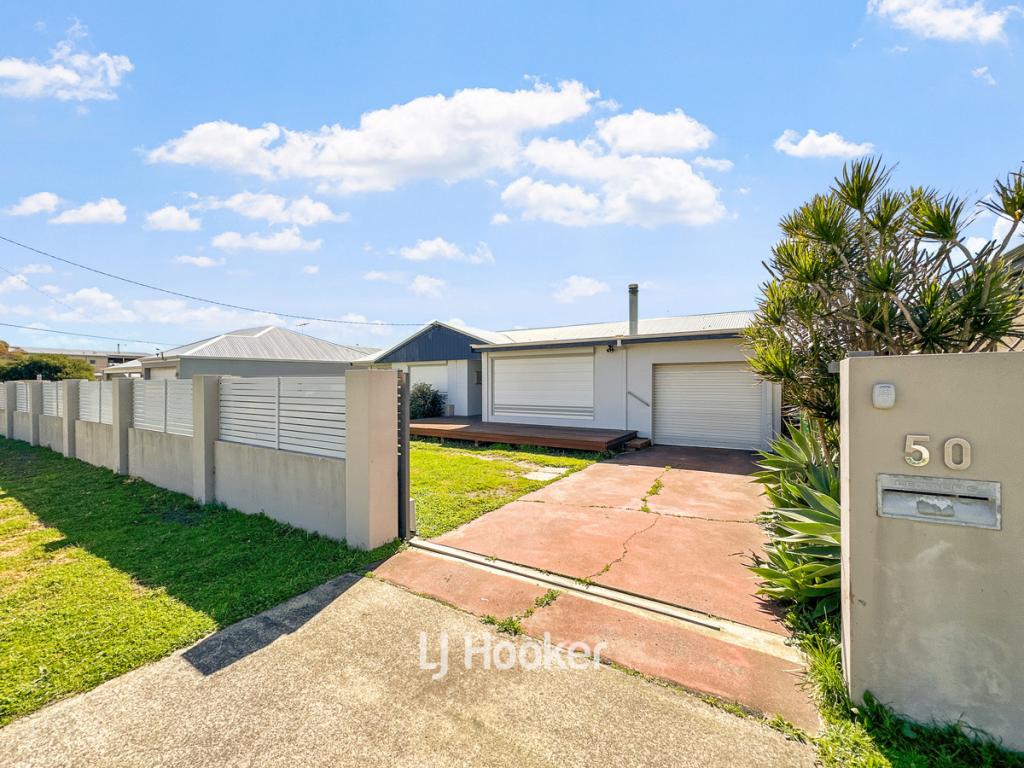 0
0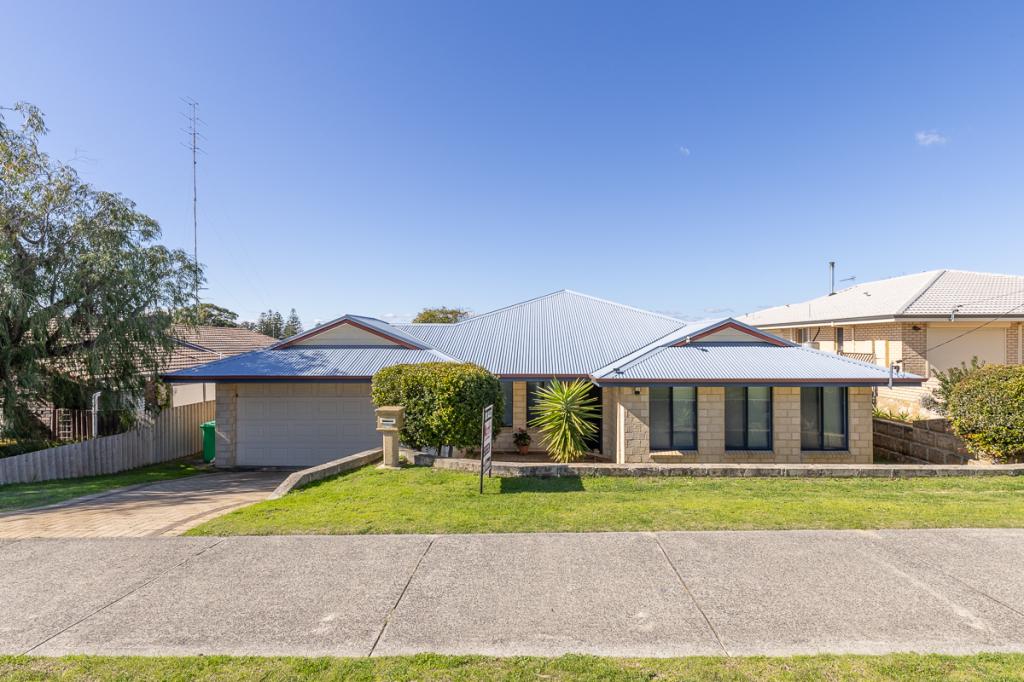 0
0About South Bunbury 6230
The size of South Bunbury is approximately 6.5 square kilometres. It has 15 parks covering nearly 20.7% of total area. The population of South Bunbury in 2011 was 8,173 people. By 2016 the population was 8,418 showing a population growth of 3.0% in the area during that time. The predominant age group in South Bunbury is 50-59 years. Households in South Bunbury are primarily childless couples and are likely to be repaying $1800 - $2399 per month on mortgage repayments. In general, people in South Bunbury work in a professional occupation. In 2011, 63.3% of the homes in South Bunbury were owner-occupied compared with 63.9% in 2016.
South Bunbury has 4,934 properties. Over the last 5 years, Houses in South Bunbury have seen a 66.66% increase in median value, while Units have seen a 99.25% increase. As at 31 July 2024:
- The median value for Houses in South Bunbury is $639,823 while the median value for Units is $453,123.
- Houses have a median rent of $555 while Units have a median rent of $500.
Suburb Insights for South Bunbury 6230
Market Insights
South Bunbury Trends for Houses
N/A
N/A
View TrendN/A
N/A
South Bunbury Trends for Units
N/A
N/A
View TrendN/A
N/A
Neighbourhood Insights
© Copyright 2024 RP Data Pty Ltd trading as CoreLogic Asia Pacific (CoreLogic). All rights reserved.
This product uses cookies and other similar technologies to improve and customise your browsing experience, to tailor content and adverts, and for analytics and metrics regarding visitor usage on this product and other media. We may share cookie and analytics information with third parties for the purposes of advertising. By continuing to use our website, you consent to cookies being used. View our Privacy Policy here.
X