11/35 Main StreetOsborne Park WA 6017
Property Details for 11/35 Main St, Osborne Park
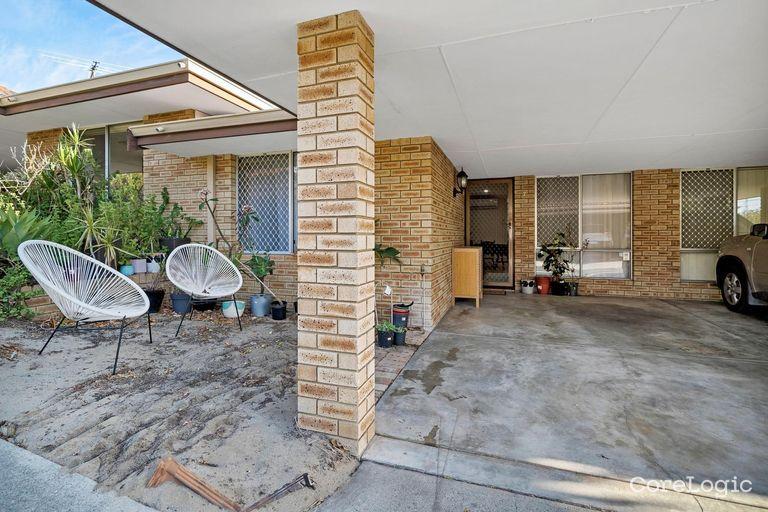
11/35 Main St, Osborne Park is a 1 bedroom, 1 bathroom Unit with 1 parking spaces and was built in 1978. The property has a land size of 64m2 and floor size of 54m2. While the property is not currently for sale or for rent, it was last sold in November 1991.
Last Listing description (March 2016)
WITH ONLY 2-STOREYS AND 18 UNITS IN TOTAL, THIS COMPLEX IS WELL LOCATED ON THE THE SOUTH END OF MAIN ST WITHIN WALKING DISTANCE TO OSSIE PARK CENTRAL. THESE UNITS ARE SPACIOUS WITH AN OPEN-PLAN KITCHEN AND LIVING AREA. WALL-TO-WALL BIR TO THE SINGLE BEDROOM. FEATURES CERAMIC HOTPLATE AND A MODERN KITCHEN WITH ADEQUATE BENCHTOP AND CUPBOARDS. SORRY, NO PETS AND NO PHONE LINES INSTALLED. MINIMUM OF 6 MONTH LEASE, 12 MONTH LEASE PREFERRED. BLACKBURNE APPLICATIONS AVAILABLE UPON VIEWING THE PROPERTY ONLY. PLEASE CONTACT VICTORIA ON THE ABOVE DETAILS TO ARRANGE AN ALTERNATE VIEWING *NOTE: IT IS IMPORTANT THAT YOU SELECT THE ?BOOK INSPECTION TIME? BUTTON AND REGISTER YOUR DETAILS TO ENSURE YOU RECEIVE UPDATES ON ANY UNFORESEEN CHANGES OR CANCELLATIONS OF VIEWING TIMES.
Property History for 11/35 Main St, Osborne Park, WA 6017
- 23 Nov 2015Listed for Rent $260 / week
- 27 Nov 1991Sold for $172,000
Commute Calculator
Recent sales nearby
See more recent sales nearbySimilar properties For Sale nearby
See more properties for sale nearby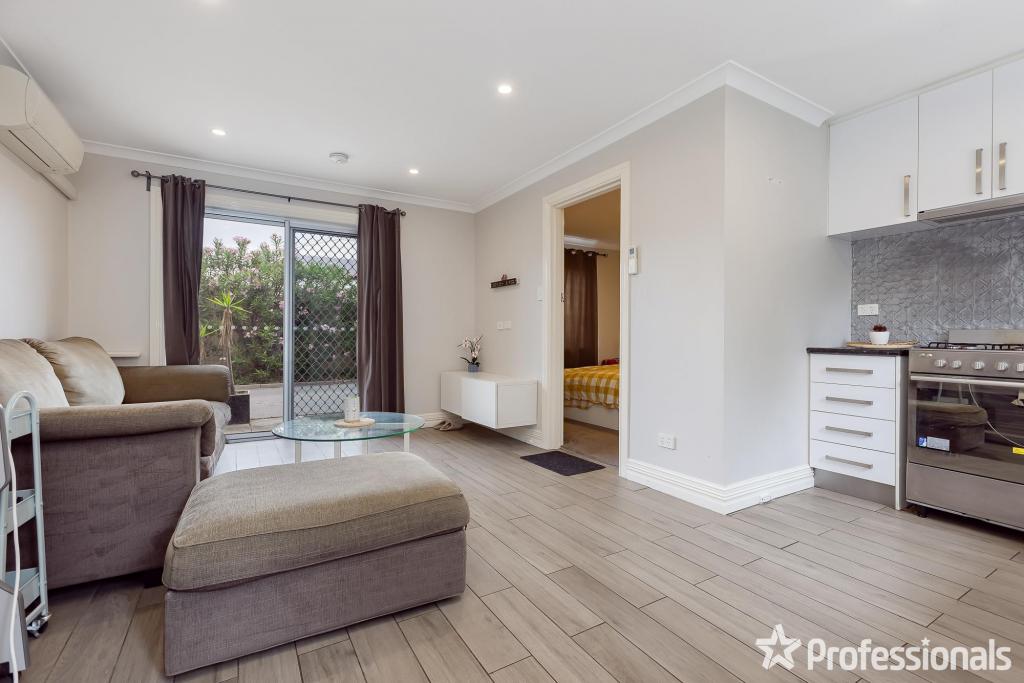 0
0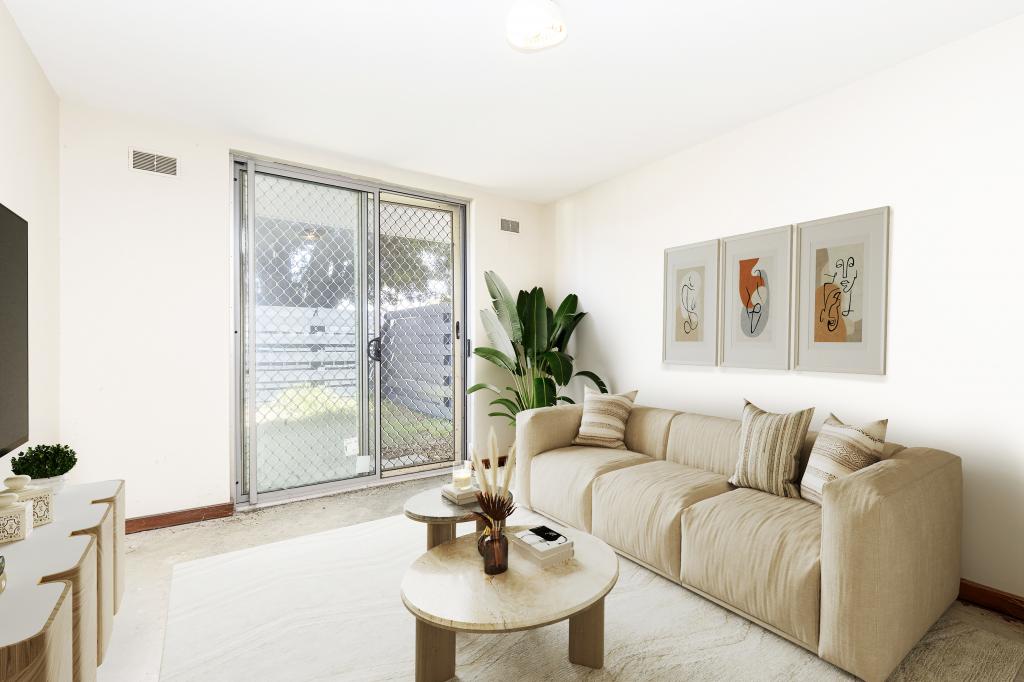 0
0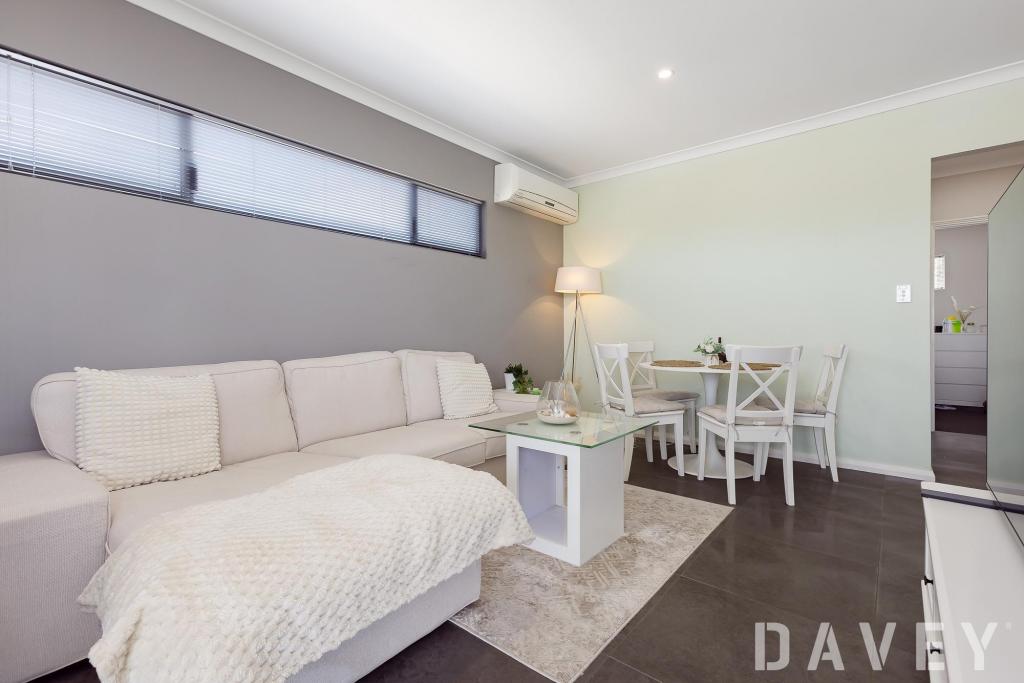 0
0Similar properties For Rent nearby
See more properties for rent nearby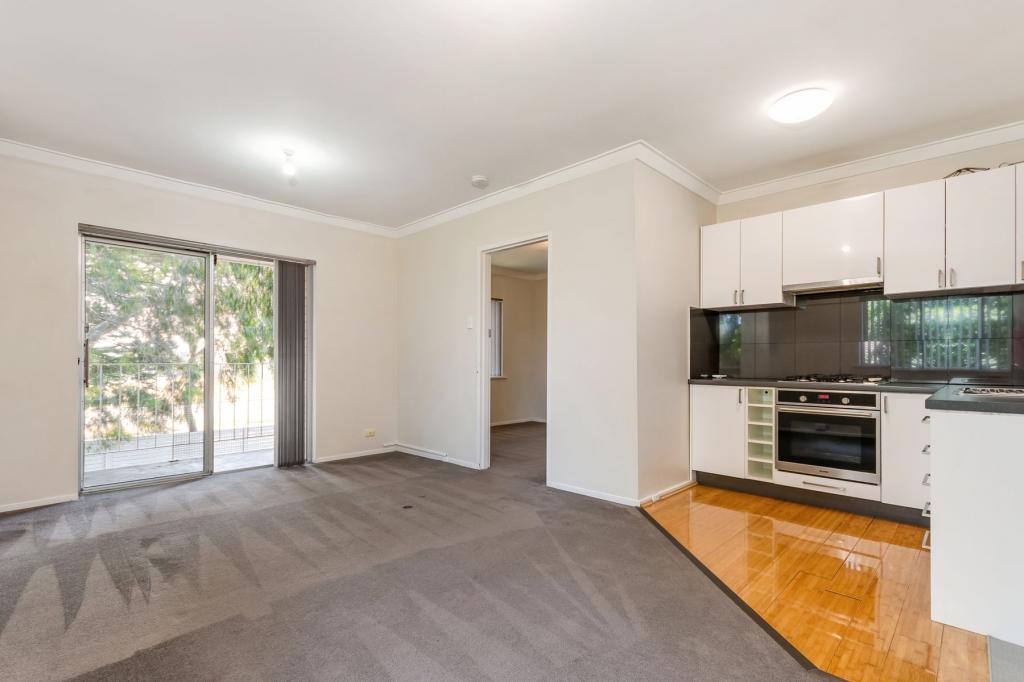 0
0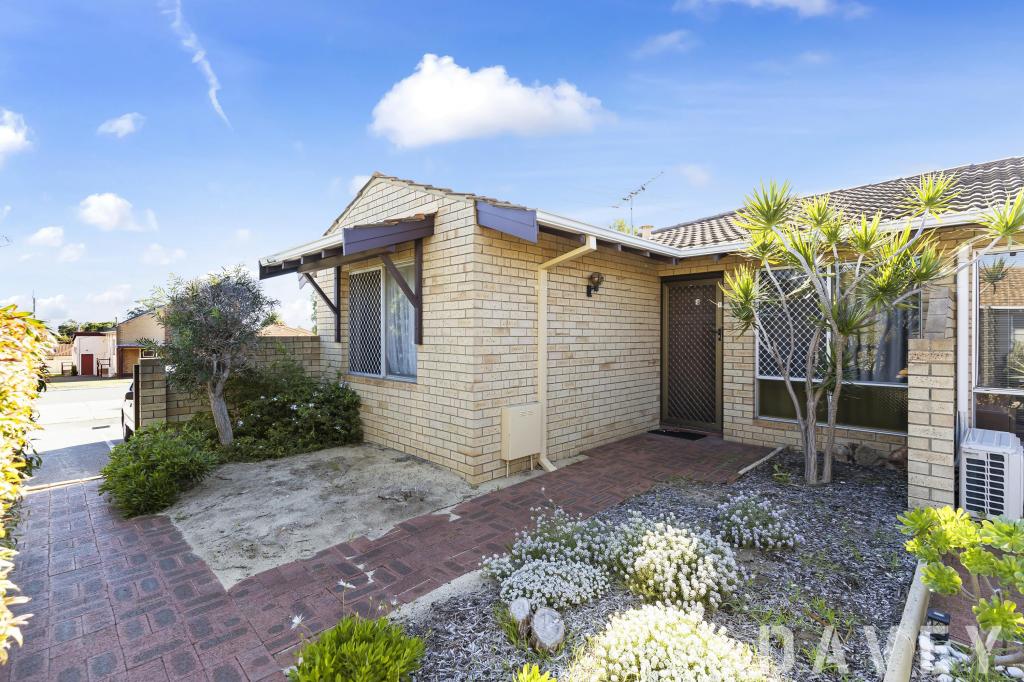 0
0
 0
0About Osborne Park 6017
The size of Osborne Park is approximately 5 square kilometres. It has 3 parks covering nearly 0.3% of total area. The population of Osborne Park in 2011 was 4,047 people. By 2016 the population was 4,106 showing a population growth of 1.5% in the area during that time. The predominant age group in Osborne Park is 20-29 years. Households in Osborne Park are primarily childless couples and are likely to be repaying $1800 - $2399 per month on mortgage repayments. In general, people in Osborne Park work in a professional occupation. In 2011, 46.5% of the homes in Osborne Park were owner-occupied compared with 45.3% in 2016.
Osborne Park has 4,640 properties. Over the last 5 years, Houses in Osborne Park have seen a 54.52% increase in median value, while Units have seen a 91.97% increase. As at 31 October 2024:
- The median value for Houses in Osborne Park is $920,505 while the median value for Units is $469,043.
- Houses have a median rent of $750 while Units have a median rent of $530.
Suburb Insights for Osborne Park 6017
Market Insights
Osborne Park Trends for Houses
N/A
N/A
View TrendN/A
N/A
Osborne Park Trends for Units
N/A
N/A
View TrendN/A
N/A
Neighbourhood Insights
© Copyright 2024 RP Data Pty Ltd trading as CoreLogic Asia Pacific (CoreLogic). All rights reserved.
This product uses cookies and other similar technologies to improve and customise your browsing experience, to tailor content and adverts, and for analytics and metrics regarding visitor usage on this product and other media. We may share cookie and analytics information with third parties for the purposes of advertising. By continuing to use our website, you consent to cookies being used. View our Privacy Policy here.
X