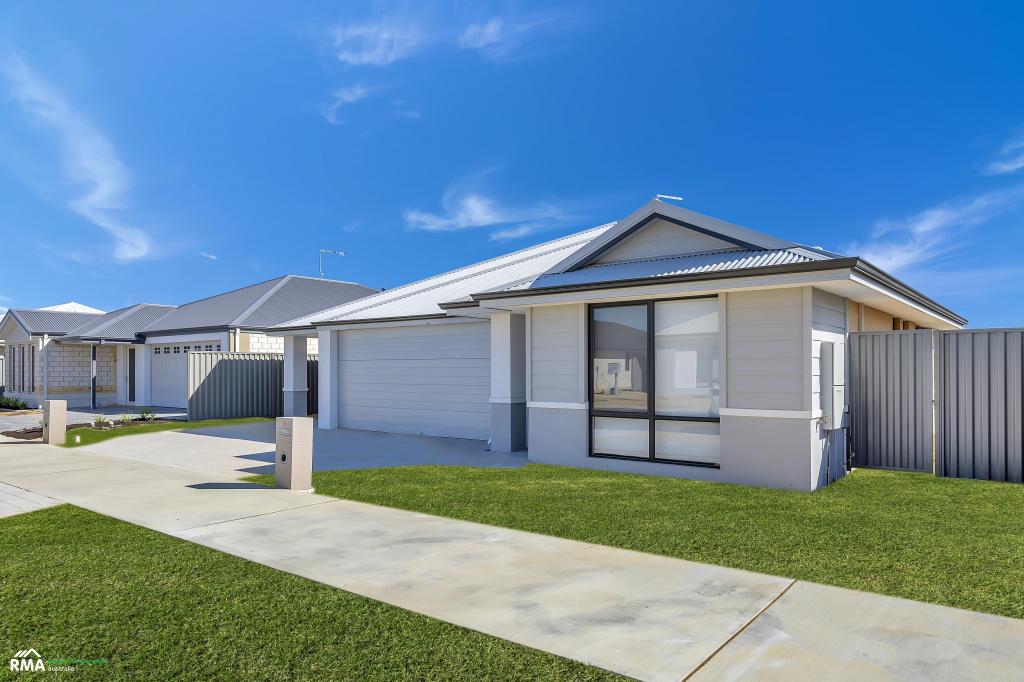
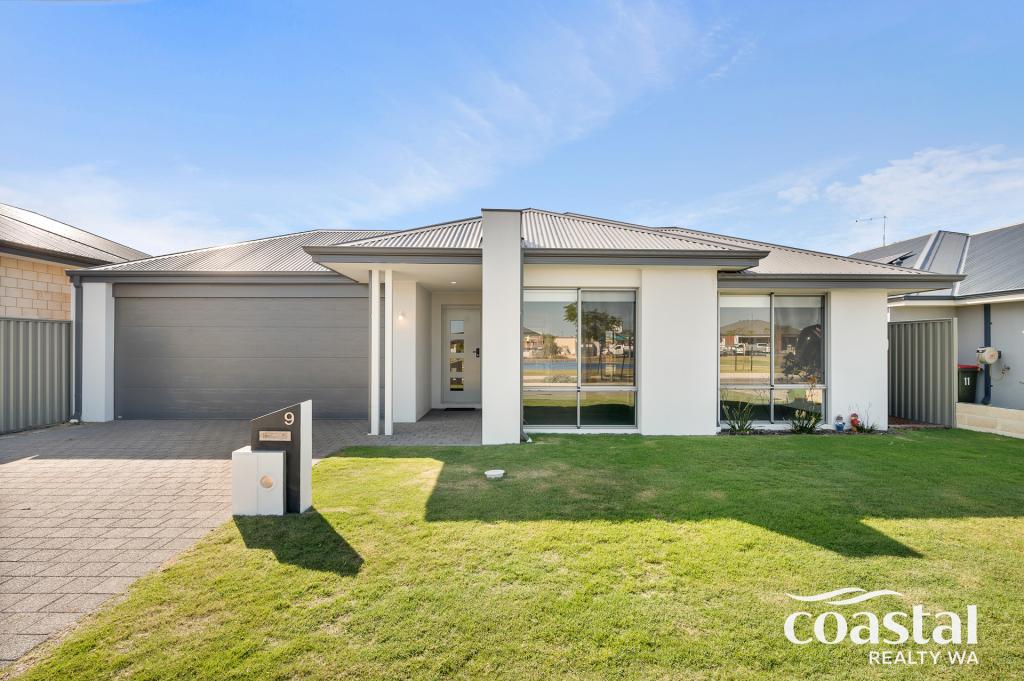
5 North Yunderup RoadNorth Yunderup WA 6208

Thinking about insurance?
Get estimated rebuild costs for this property with Sum SureProperty Details for 5 North Yunderup Rd, North Yunderup
5 North Yunderup Rd, North Yunderup is a 3 bedroom, 3 bathroom House with 3 parking spaces and was built in 2001. The property has a land size of 1012m2 and floor size of 179m2. While the property is not currently for sale or for rent, it was last sold in February 2001.
Property History for 5 North Yunderup Rd, North Yunderup, WA 6208
- 21 Feb 2001Sold for $36,000
- 19 Apr 1996Sold for $35,000
- 13 Sep 1988Sold for $9,950
Recent sales nearby
See more recent sales nearbySimilar properties For Sale nearby
See more properties for sale nearby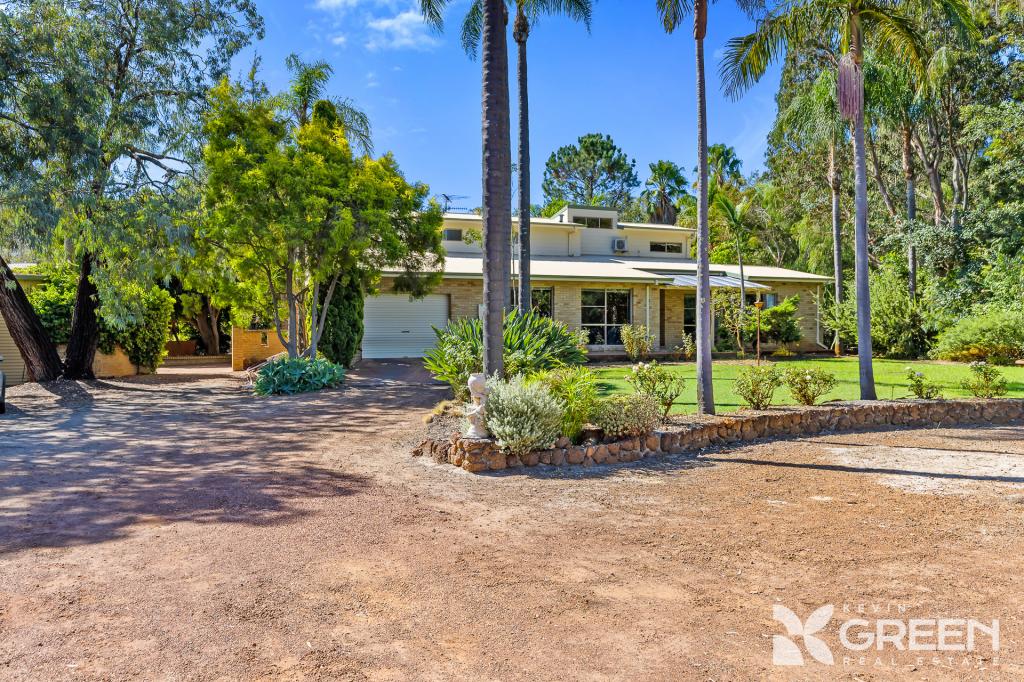
Similar properties For Rent nearby
See more properties for rent nearby
About North Yunderup 6208
The size of North Yunderup is approximately 4.2 square kilometres. It has 3 parks covering nearly 2.8% of total area. The population of North Yunderup in 2011 was 848 people. By 2016 the population was 827 showing a population decline of 2.5% in the area during that time. The predominant age group in North Yunderup is 50-59 years. Households in North Yunderup are primarily childless couples and are likely to be repaying $1800 - $2399 per month on mortgage repayments. In general, people in North Yunderup work in a trades occupation. In 2011, 78.7% of the homes in North Yunderup were owner-occupied compared with 83.5% in 2016.
North Yunderup has 527 properties. Over the last 5 years, Houses in North Yunderup have seen a 71.84% increase in median value, while Units have seen a 44.66% increase. As at 28 February 2025:
- The median value for Houses in North Yunderup is $650,524 while the median value for Units is $353,168.
- Houses have a median rent of $550.
What's around 5 North Yunderup Rd, North Yunderup


Suburb Insights for North Yunderup 6208
Market Insights
North Yunderup Trends for Houses
$651k
16.02%
View Trend$550/W
4.62%
North Yunderup Trends for Units
$353k
N/A
View TrendN/A
5.76%
Neighbourhood Insights
Age
Population 827
0-9
12%
10-19
9%
20-29
8%
30-39
9%
40-49
11%
50-59
17%
60-69
16%
70-79
11%
80-89
4%
Household Structure
Occupancy
© Copyright 2025 RP Data Pty Ltd trading as CoreLogic Asia Pacific (CoreLogic). All rights reserved.
This product uses cookies and other similar technologies to improve and customise your browsing experience, to tailor content and adverts, and for analytics and metrics regarding visitor usage on this product and other media. We may share cookie and analytics information with third parties for the purposes of advertising. By continuing to use our website, you consent to cookies being used. View our Privacy Policy here.
X