63 Seymour StreetMira Mar WA 6330
Property Details for 63 Seymour St, Mira Mar
63 Seymour St, Mira Mar is a 2 bedroom, 1 bathroom House and was built in 1962. The property has a land size of 639m2 and floor size of 106m2. While the property is not currently for sale or for rent, it was last sold in September 1993.
Last Listing description (April 2024)
Why you should lease me? - Two bedrooms, both well-sized - Fully enclosed large back yard - Lawn mowing included - Gas heater included- Sorry no pets Available from the 24th of April, 2024Location is key! If being close to the CBD is what you are after, then don't look passed this neat and tidy 2 bedroom, 1 bathroom home located only a few minutes drive. Lawn mowing included WANTING TO VIEW?- Select "Request a Time" or "Get in Touch"- You will instantly be informed of any updates, changes or cancellations for your appointment- If no one registers for a viewing, the viewing may not proceed- Times are only scheduled Monday to Friday between 8:30am and 5:00pm- Each viewing is held for a 10 minute time slot- Sorry, no individual viewings
Property History for 63 Seymour St, Mira Mar, WA 6330
- 02 Apr 2024Listed for Rent $360 / week
- 29 Aug 2023Listed for Rent $320 / week
- 28 Nov 2019Listed for Sale $325,000
Commute Calculator
Recent sales nearby
See more recent sales nearby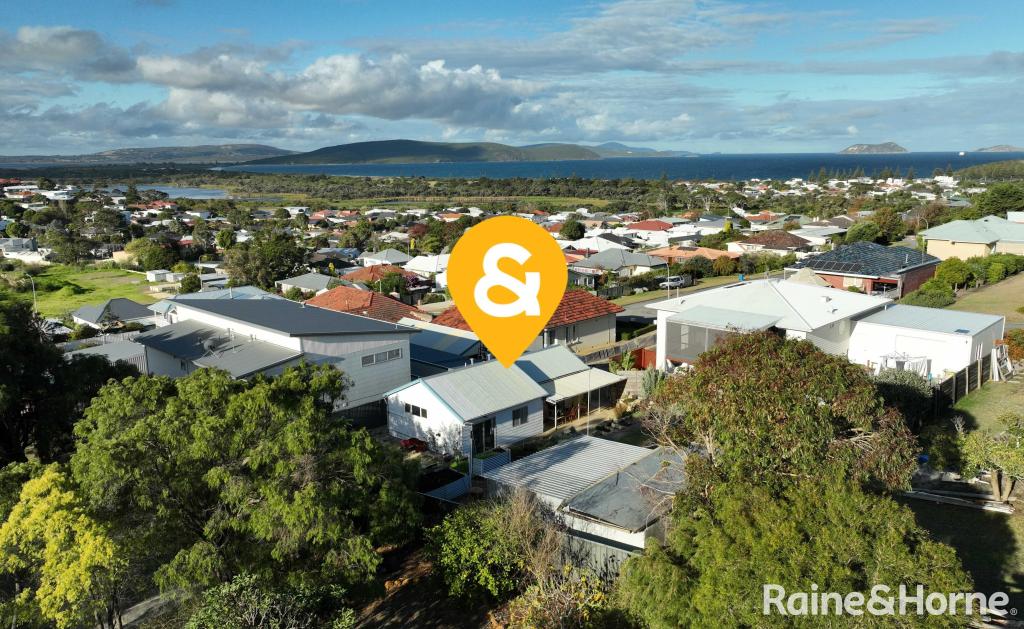 0
0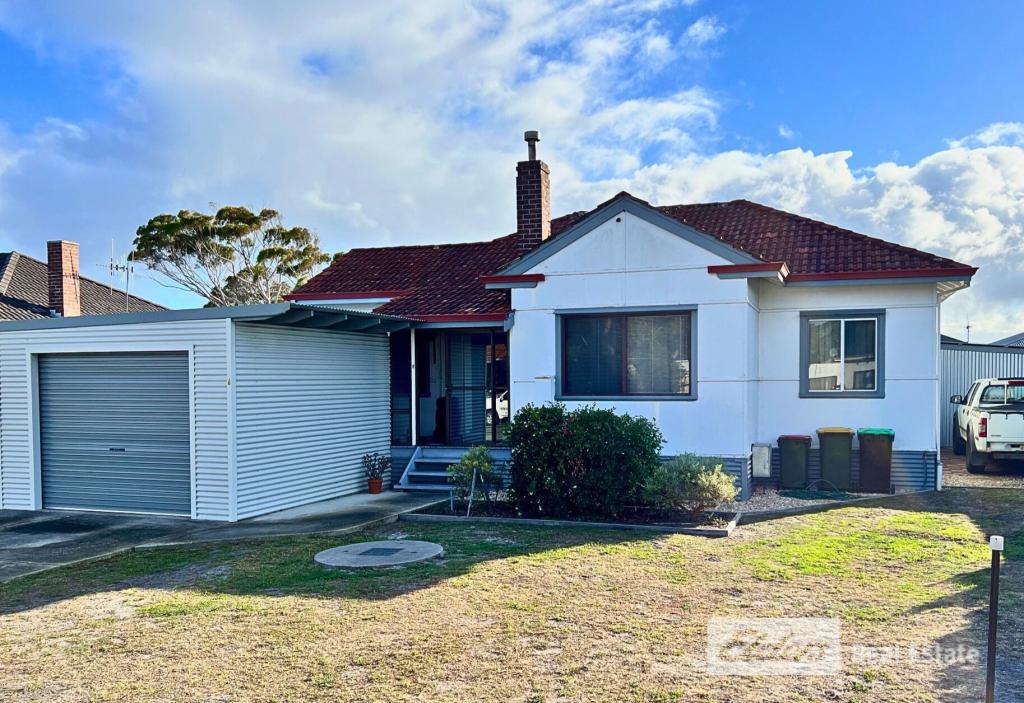 0
0
Similar properties For Sale nearby
See more properties for sale nearby 0
0 0
0 0
0Similar properties For Rent nearby
See more properties for rent nearby 0
0 0
0
 0
0About Mira Mar 6330
The size of Mira Mar is approximately 1.5 square kilometres. It has 4 parks covering nearly 8.2% of total area. The population of Mira Mar in 2011 was 1,682 people. By 2016 the population was 1,742 showing a population growth of 3.6% in the area during that time. The predominant age group in Mira Mar is 50-59 years. Households in Mira Mar are primarily childless couples and are likely to be repaying $1800 - $2399 per month on mortgage repayments. In general, people in Mira Mar work in a professional occupation. In 2011, 58.2% of the homes in Mira Mar were owner-occupied compared with 59.6% in 2016.
Mira Mar has 1,224 properties. Over the last 5 years, Houses in Mira Mar have seen a 59.97% increase in median value, while Units have seen a 15.08% increase. As at 31 October 2024:
- The median value for Houses in Mira Mar is $620,933 while the median value for Units is $276,641.
- Houses have a median rent of $500 while Units have a median rent of $383.
Suburb Insights for Mira Mar 6330
Market Insights
Mira Mar Trends for Houses
N/A
N/A
View TrendN/A
N/A
Mira Mar Trends for Units
N/A
N/A
View TrendN/A
N/A
Neighbourhood Insights
© Copyright 2024 RP Data Pty Ltd trading as CoreLogic Asia Pacific (CoreLogic). All rights reserved.
This product uses cookies and other similar technologies to improve and customise your browsing experience, to tailor content and adverts, and for analytics and metrics regarding visitor usage on this product and other media. We may share cookie and analytics information with third parties for the purposes of advertising. By continuing to use our website, you consent to cookies being used. View our Privacy Policy here.
X