54 Sheridan StreetMenzies WA 6436

Thinking about insurance?
Get estimated rebuild costs for this property with Sum SureProperty Details for 54 Sheridan St, Menzies
54 Sheridan St, Menzies is a 0 bedroom, 0 bathroom House. The property has a land size of 1012m2. While the property is not currently for sale or for rent, it was last sold in October 2023.
Last Listing description (March 2024)
Located approximately one hour from Kalgoorlie, this very keenly priced acre block awaits a smart investor. With local industry including pastoral farming, tourism, gold & nickel mining and infrastructure including, shopping centre, hotel, roadhouse, school, tennis courts, indoor courts for badmington/vollyball, a golf course and town oval there is something here for everyone.
Fraser Williams 0439 092 248
Property History for 54 Sheridan St, Menzies, WA 6436
- 27 Mar 2024Listed for Sale Not Disclosed
- 11 Oct 2023Sold for $8,500
- 18 Sep 2023Listed for Sale SOLD - Price Withheld
Recent sales nearby
See more recent sales nearby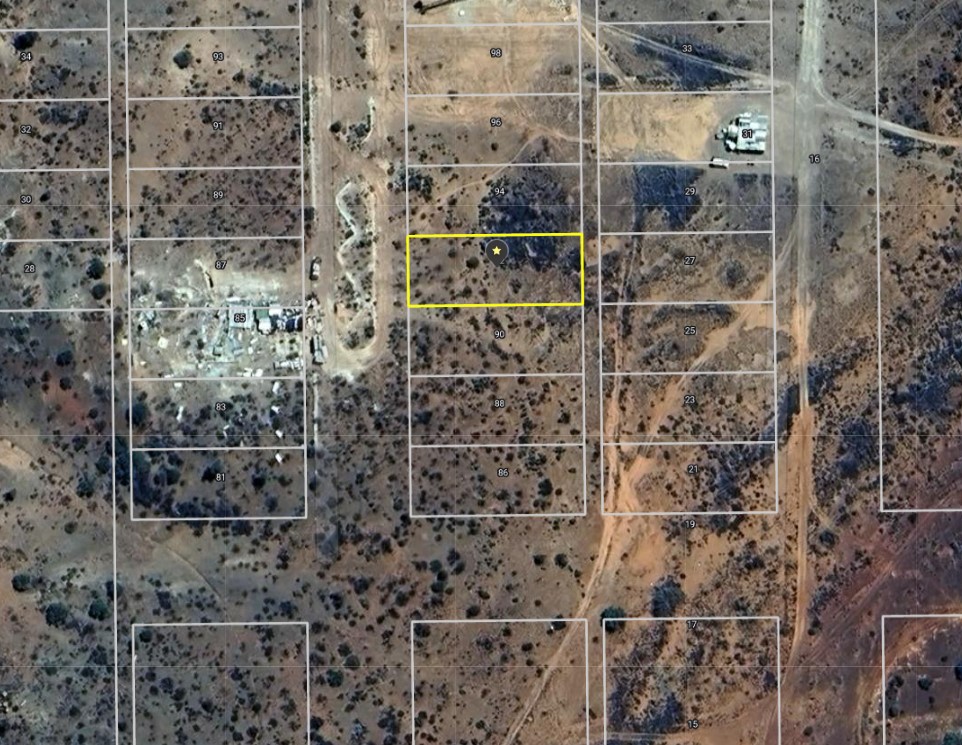
About Menzies 6436
The size of Menzies is approximately 8,194.6 square kilometres. It has 2 parks covering nearly 7.3% of total area. The population of Menzies in 2011 was 180 people. By 2016 the population was 109 showing a population decline of 39.4% in the area during that time. The predominant age group in Menzies is 50-59 years. Households in Menzies are primarily single parents and are likely to be repaying $1400 - $1799 per month on mortgage repayments. In general, people in Menzies work in a professional occupation. In 2011, 37% of the homes in Menzies were owner-occupied compared with 29.3% in 2016.
Menzies has 568 properties. Over the last 5 years, Houses in Menzies have seen a -5.22% decrease in median value. As at 31 March 2025:
- The median value for Houses in Menzies is $281,264.
What's around 54 Sheridan St, Menzies


Suburb Insights for Menzies 6436
Market Insights
Menzies Trends for Houses
$281k
16.49%
View TrendN/A
37.08%
Menzies Trends for Units
N/A
N/A
View TrendN/A
N/A
Neighbourhood Insights
Age
Population 109
0-9
4%
10-19
14%
20-29
18%
30-39
6%
40-49
14%
50-59
23%
60-69
23%
Household Structure
Occupancy
© Copyright 2025 RP Data Pty Ltd trading as CoreLogic Asia Pacific (CoreLogic). All rights reserved.
This product uses cookies and other similar technologies to improve and customise your browsing experience, to tailor content and adverts, and for analytics and metrics regarding visitor usage on this product and other media. We may share cookie and analytics information with third parties for the purposes of advertising. By continuing to use our website, you consent to cookies being used. View our Privacy Policy here.
X