25 Marsh AvenueManning WA 6152
Property Details for 25 Marsh Ave, Manning
25 Marsh Ave, Manning is a 3 bedroom, 1 bathroom House and was built in 1960. The property has a land size of 799m2 and floor size of 400m2. While the property is not currently for sale or for rent, it was last sold in May 2012.
Last Listing description (July 2012)
BUILDING BLOCK
**AVAILABLE FOR VIEWING OVER THE CHRISTMAS BREAK** POSITIONED IN A QUIET TREE LINED STREET AND ONLY MINUTES FROM WELWYN AVENUE SHOPPING & LOCAL PARKS, YOU'LL FIND THIS PERFECT BUILDING BLOCK. WITH A MASSIVE 26.1 METRE STREET FRONTAGE AND OFFERING 800SQM OF FLAT & LEVEL LAND, YOU'LL BE ABLE TO BUILD A SENSATIONAL HOME WITH PLENTY OF ROOM FOR A GROWING FAMILY. A BONUS 2/3 BEDROOM ORIGINAL AND RENTABLE HOME WILL GIVE YOU AN INCOME WHILE YOUR PLANS APPROVED. FOR FURTHER DETAILS OR TO ARRANGE AN INSPECTION, PLEASE CONTACT GARRICK MCCAMEY ON 0416 112 994 OR JAY ROGERS ON 0414 831 507
Property History for 25 Marsh Ave, Manning, WA 6152
- 29 May 2012Sold for $635,000
- 22 Dec 2011Listed for Sale $675,000
Commute Calculator
Recent sales nearby
See more recent sales nearby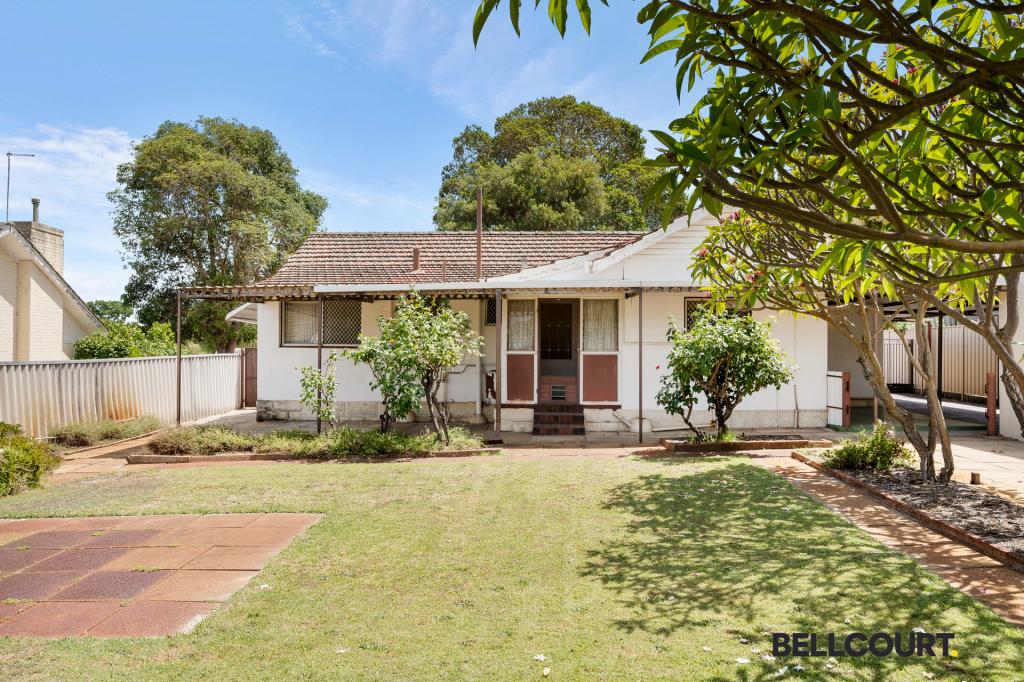 0
0Similar properties For Sale nearby
See more properties for sale nearby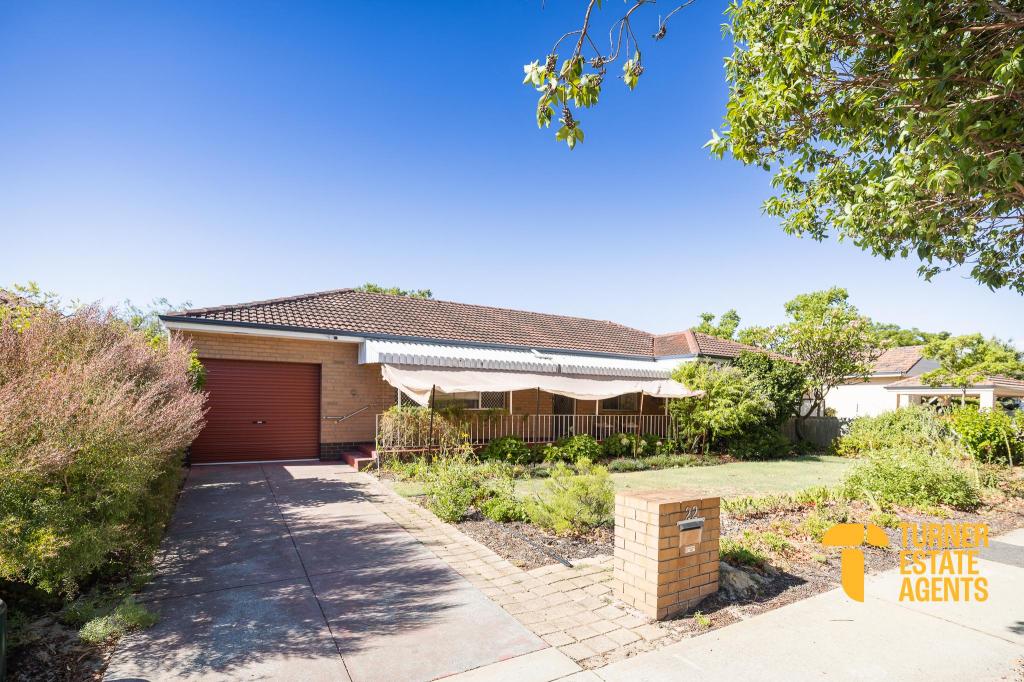 0
0 0
0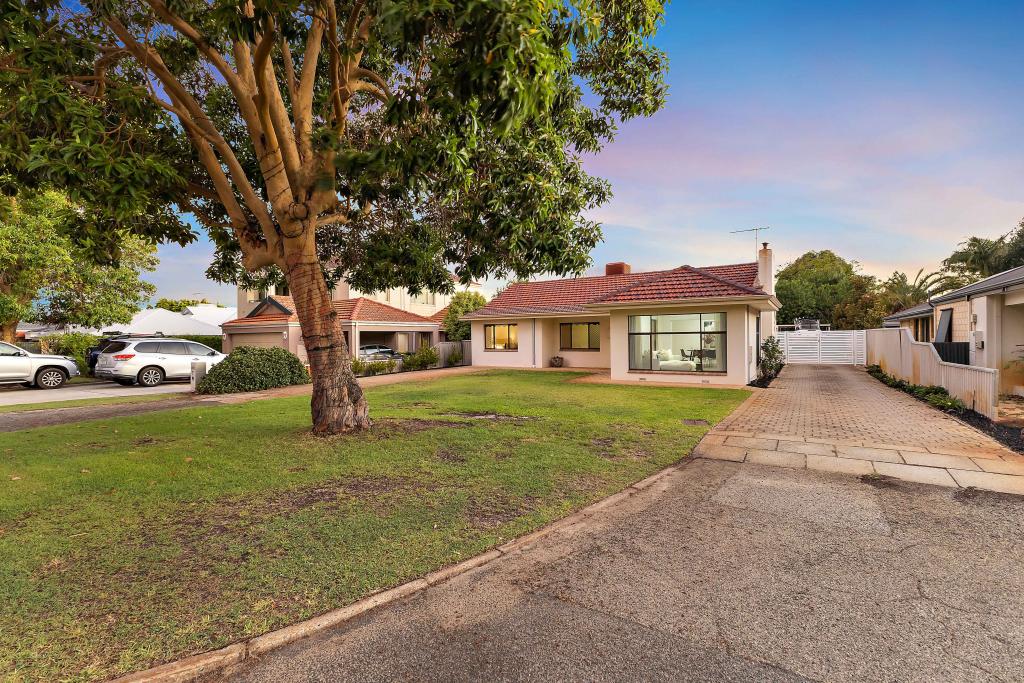 0
0Similar properties For Rent nearby
See more properties for rent nearby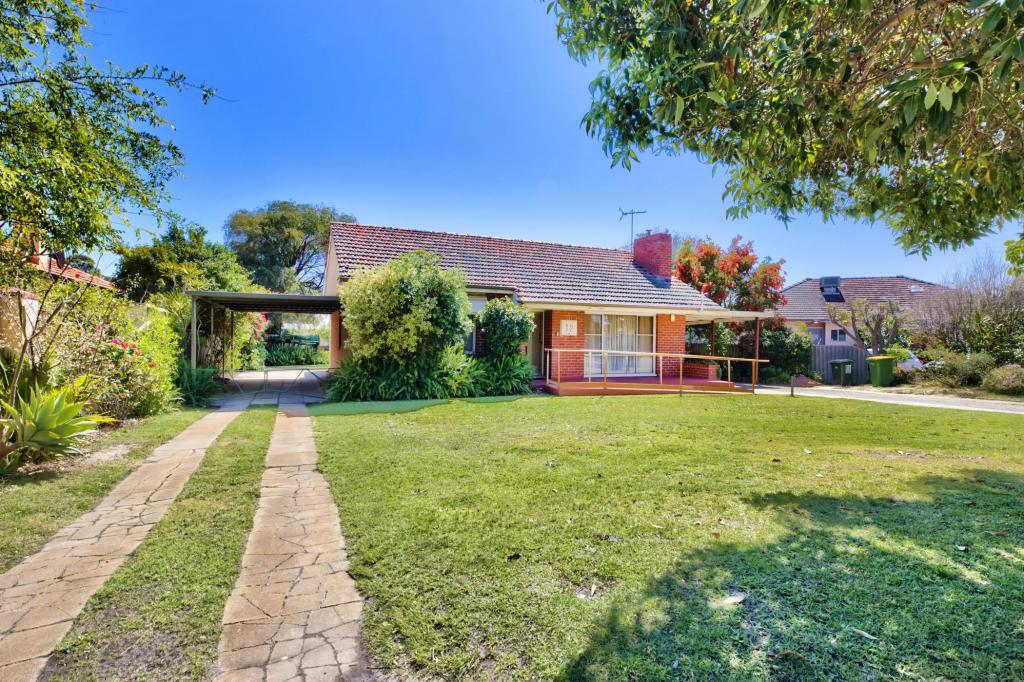 0
0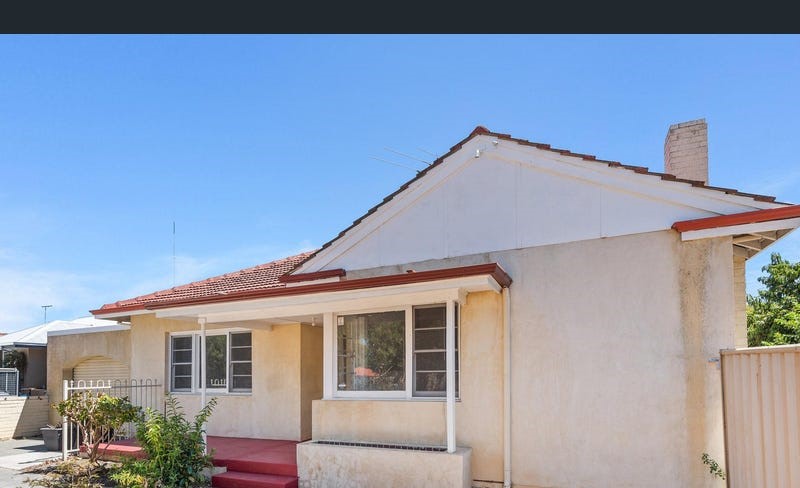 0
0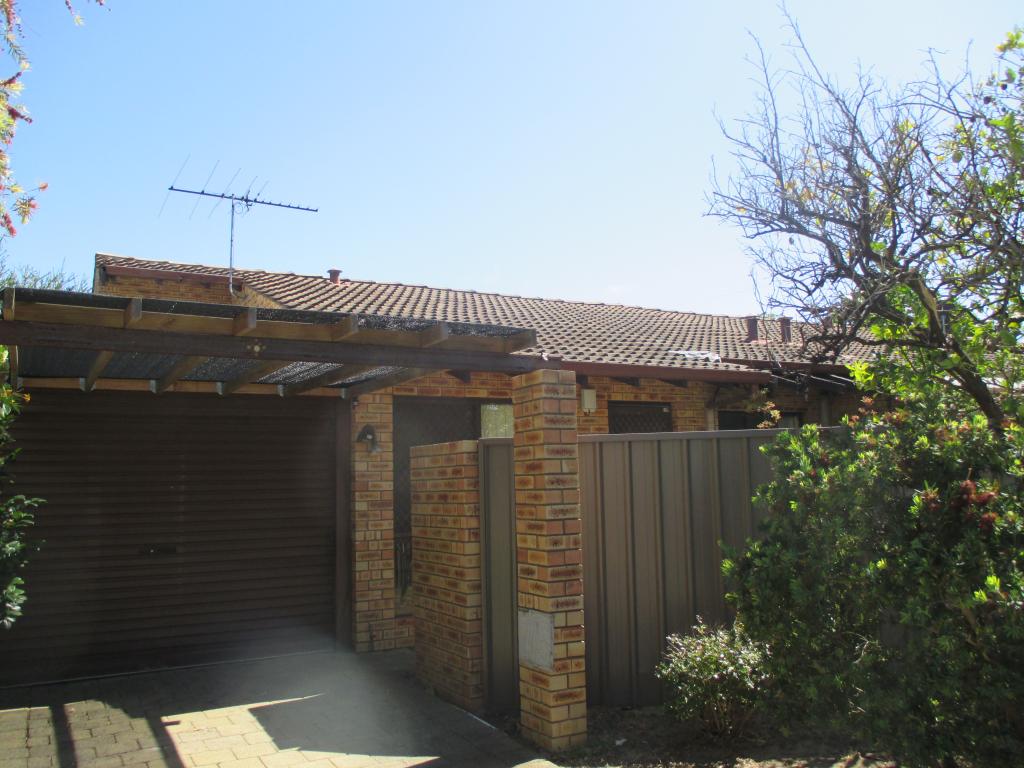 0
0About Manning 6152
The size of Manning is approximately 1.7 square kilometres. It has 13 parks covering nearly 17.3% of total area. The population of Manning in 2011 was 4,017 people. By 2016 the population was 4,129 showing a population growth of 2.8% in the area during that time. The predominant age group in Manning is 40-49 years. Households in Manning are primarily couples with children and are likely to be repaying $3000 - $3999 per month on mortgage repayments. In general, people in Manning work in a professional occupation. In 2011, 62.2% of the homes in Manning were owner-occupied compared with 66.6% in 2016.
Manning has 1,970 properties. Over the last 5 years, Houses in Manning have seen a 70.99% increase in median value, while Units have seen a 94.21% increase. As at 31 January 2025:
- The median value for Houses in Manning is $1,281,823 while the median value for Units is $799,249.
- Houses have a median rent of $800 while Units have a median rent of $798.
Suburb Insights for Manning 6152
Market Insights
Manning Trends for Houses
N/A
N/A
View TrendN/A
N/A
Manning Trends for Units
N/A
N/A
View TrendN/A
N/A
Neighbourhood Insights
© Copyright 2025 RP Data Pty Ltd trading as CoreLogic Asia Pacific (CoreLogic). All rights reserved.
This product uses cookies and other similar technologies to improve and customise your browsing experience, to tailor content and adverts, and for analytics and metrics regarding visitor usage on this product and other media. We may share cookie and analytics information with third parties for the purposes of advertising. By continuing to use our website, you consent to cookies being used. View our Privacy Policy here.
X