OFF MARKET
Are you the owner?

8/59 The Esplanade
Esperance WA 6450

Bedrooms: 1
Bathrooms: 1
Car spaces: 1
Floor area: 41m2
Land area: 40m2
Estimated Value & Rent
Estimated Value
Estimated Rent
Low Confidence
Last updated 24 Mar 2025
Low

High
$325k
$350k
Save

Property Details for 8/59 The Esplanade, Esperance

8/59 The Esplanade, Esperance is a 1 bedroom, 1 bathroom Unit with 1 parking spaces and was built in 1985. The property has a land size of 40m2 and floor size of 41m2. While the property is not currently for sale or for rent, it was last sold in March 2023.

Building Type
Unit
Year Built
1985
Floor Size
41m2
Land Size
40m2
Local Government
Esperance
Lot/Plan
8/S013032

Last Listing description (June 2023)

*** Pending Application***COMFORTABLE WITH EVERYTHING YOU NEEDFully furnished unit, in a modern trendy style. Close enough to walk to town central and foreshore with distant ocean views.Features include:* Fully furnished * Open plan kitchen/meals* Built in robes in bedroom* Ceiling fan in living area* Reverse cycle air conditioner* Enclosed backyard with BBQ* SORRY NO PETSTo book a viewing, please click on 'Book Inspection/Request an Inspection' button below.

Property History for 8/59 The Esplanade, Esperance, WA 6450

A timeline of how this property has performed in the market
Last Sold
$255,500
07 Mar 2023
Listed for Rent
$400/w
09 Jun 2023
  • 11 May 2023
    Listed for Rent $400 / week
  • 07 Mar 2023
    Sold for $255,500
  • 11 Nov 2022
    Listed for Sale $260,000
Sign in to see more transactions

Commute Calculator

Where to?
-
-
-
-

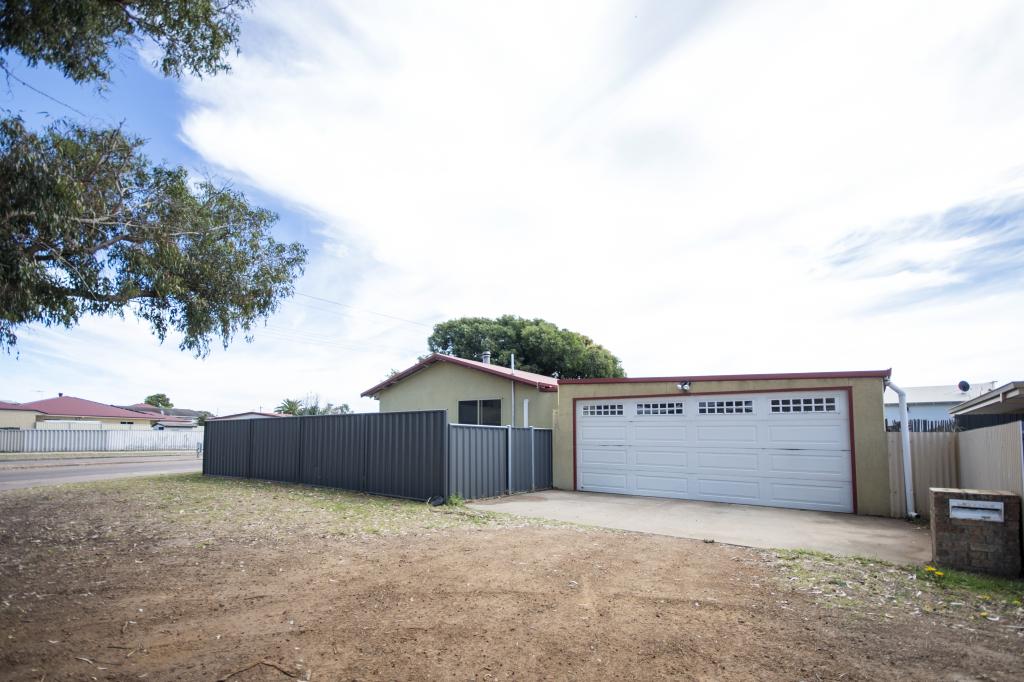
About Esperance 6450

The size of Esperance is approximately 2.5 square kilometres. It has 7 parks covering nearly 18.7% of total area. The population of Esperance in 2011 was 2,086 people. By 2016 the population was 2,153 showing a population growth of 3.2% in the area during that time. The predominant age group in Esperance is 50-59 years. Households in Esperance are primarily childless couples and are likely to be repaying $1800 - $2399 per month on mortgage repayments. In general, people in Esperance work in a trades occupation. In 2011, 47.9% of the homes in Esperance were owner-occupied compared with 45.5% in 2016.

Esperance has 1,525 properties. Over the last 5 years, Houses in Esperance have seen a 93.41% increase in median value, while Units have seen a 63.07% increase. As at 28 February 2025:

  • The median value for Houses in Esperance is $416,921 while the median value for Units is $377,882.
  • Houses have a median rent of $355 while Units have a median rent of $445.
There are currently 2 properties listed for sale, and no properties listed for rent in Esperance on OnTheHouse. According to CoreLogic's data, 61 properties were sold in the past 12 months in Esperance.

What's around 8/59 The Esplanade, Esperance

Nearby Schools
Comparable Properties
Esperance Primary School
0.35km
Esperance 6450
PrimaryGovernmentP - 6Combined510 Enrolled
Esperance Anglican Community School
1.02km
West Beach 6450
SecondaryNon-Government7 - 12Combined187 Enrolled
Our Lady Star of the Sea Catholic Primary School
1.23km
West Beach 6450
PrimaryNon-GovernmentP - 6Combined99 Enrolled
Esperance Christian School
1.4km
Address not found
PrimaryNon-GovernmentP - 6Combined67 Enrolled
Nulsen Primary School
1.87km
Nulsen 6450
PrimaryGovernmentP - 6Combined198 Enrolled
Esperance Education Support Centre
2.01km
Esperance 6450
SpecialGovernment7 - 12Combined15 Enrolled
Esperance Senior High School
2.1km
Esperance 6450
SecondaryGovernment7 - 12Combined939 Enrolled
Castletown Primary School
3.88km
Castletown 6450
PrimaryGovernmentP - 6Combined552 Enrolled
Wongutha Christian Aboriginal Parent-Directed School
22.72km
Gibson 6448
SecondaryNon-Government11 - 12Combined70 Enrolled
Scaddan Primary School
48.96km
Scaddan 6447
PrimaryGovernmentP - 6Combined24 Enrolled

Suburb Insights for Esperance 6450

Market Insights
Esperance Trends for Houses
Median Value

$417k

7.20%
View Trend
Median Growth

7.52%

View Trend
Median Rent

N/A

-
View Trend
Rental Yield

N/A

-
View Trend
Median Value: The middle value of all properties across the geography based on the Automated Valuation Model.


Median Value over 1 year (03/24 - 02/25)
Esperance Trends for Units
Median Value

$378k

4.41%
View Trend
Median Growth

-8.43%

View Trend
Median Rent

$445/W

23.61%
View Trend
Rental Yield

5.12%

5.35%
View Trend
Median Value: The middle value of all properties across the geography based on the Automated Valuation Model.


Median Value over 1 year (03/24 - 02/25)
Neighbourhood Insights
Age

Population 2,153

0-9


9%

10-19


10%

20-29


13%

30-39


9%

40-49


10%

50-59


15%

60-69


12%

70-79


12%

80-89


9%

90-99


3%

Household Structure
Occupancy
Disclaimer
Whilst all reasonable effort is made to ensure the information in this publication is current, CoreLogic does not warrant the accuracy or completeness of the data and information contained in this publication and to the full extent not prohibited by law excludes all liability for any loss or damage arising in connection with the data and information contained in this publication.
Valuations and Estimates
This estimate is provided by CoreLogic, and is based on statistical market data such as recent local sales, property size, number of bedrooms and many more factors. It comes from public data, which may be incomplete or inaccurate, and should not be used in lieu of a professional appraisal under any circumstances, including for lending purposes or in home loan applications.
School data and Content
Product Data licenced by CoreLogic under a Creative Commons Attribution licence. For details regarding licence, data source, copyright and disclaimers, see https://www.corelogic.com.au/legals/third-party-restrictions
ABS data
This publication contains data and statistics provided by the Australian Bureau of Statistics, available at http://www.abs.gov.au/ and reproduced under Creative Commons Attribution 2.5 http://creativecommons.org/licenses/by/2.5/au/legalcode
Liveability information
The Liveability Score is a rating (out of 10) provided by Propella.ai Pty Ltd as a guide about how "well-connected" properties are in certain local areas. The Liveability Score is based on statistical data about a local area in which a property is located including the distance to and number of available facilities and services (including schools, parklands, health services, shopping and public transport) (Liveability Data). The Liveability Data and Liveability Score has not been verified or confirmed by CoreLogic, is not available for all properties, and is of a general nature and should not be construed as specific advice or relied upon in lieu of appropriate professional advice. Given the relative nature of the Liveability Score, propella.ai anticipate that scores for individual properties will change over time.