9 Tobermory PassCanning Vale WA 6155
Property Details for 9 Tobermory Pass, Canning Vale
9 Tobermory Pass, Canning Vale is a 4 bedroom, 2 bathroom House with 2 parking spaces and was built in 2000. The property has a land size of 666m2 and floor size of 230m2. While the property is not currently for sale or for rent, it was last sold in September 2023.
Last Listing description (June 2024)
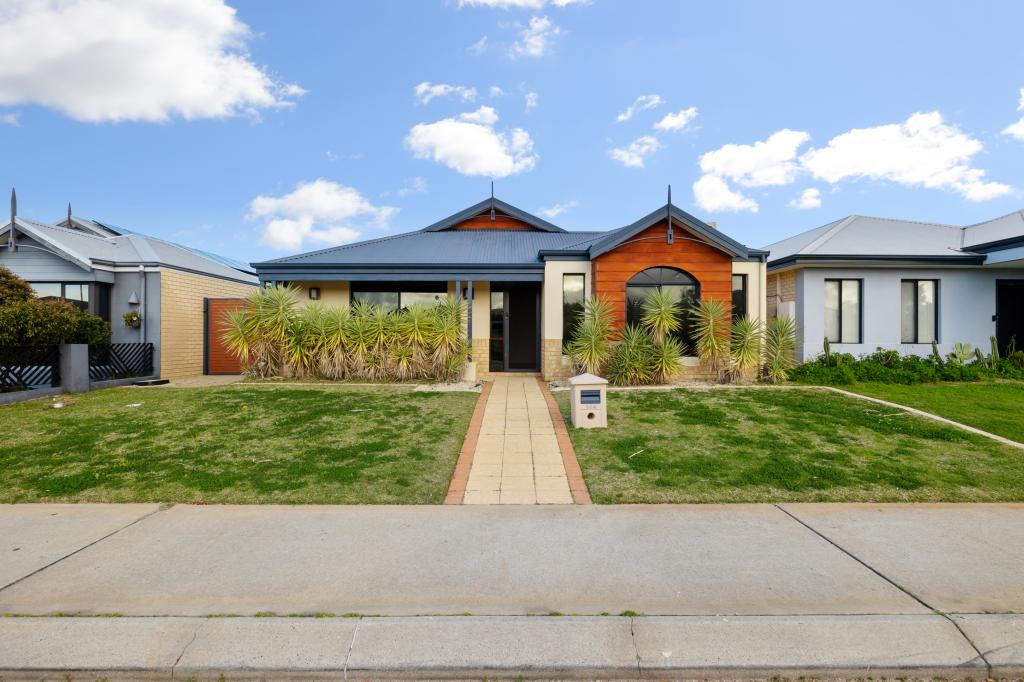
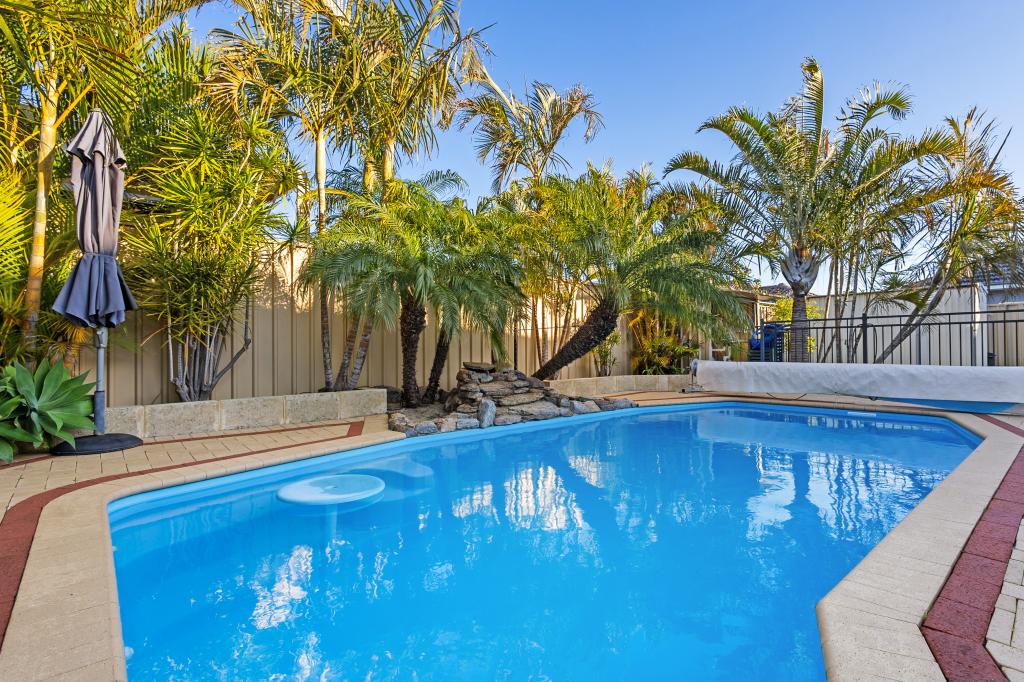
This charming and captivating residence is the epitome of impressive family living. Tranquilly located, the property enjoys enviable proximity being located close to Ranford Oval and situated close to Livingston Shopping Centre.
The property is ensuring comfort throughout the hot summer months. Energized by natural light throughout, the property also offers the freedom to entertain year-round with ample indoor-outdoor space for the entire family to enjoy.
Other additional luxuries include:
* Four generously-sized bedrooms
* Well appointed bathrooms
* Extra loft area can be used as Living room, Study Room or Office
* Open plan kitchen overlooking meal area
* Reverse cycle air conditioning
* Extra space for game area
* Double Car Garage
* In close proximity to all amenities such as Ranford Oval, Livingston Shopping Center and all major traffic routes
Make this your #1 on your viewing list today!
Council Rate:$2139 per annum
Water rate: $1431.22 per annum
For more information please contact Max Park on 0403 038 647 or Tim Huynh on 0450 435 854.
Property History for 9 Tobermory Pass, Canning Vale, WA 6155
- 11 Sep 2023Sold for $822,300
- 07 Sep 2023Listed for Sale Not Disclosed
- 11 Oct 2008Listed for Rent - Price not available
Commute Calculator
Recent sales nearby
See more recent sales nearby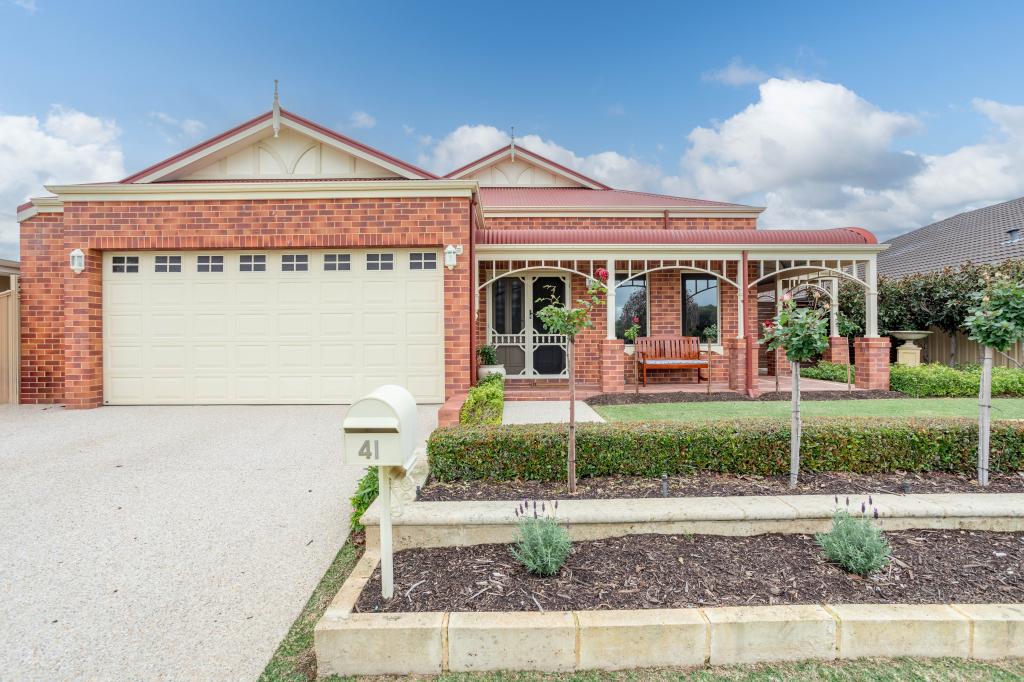 0
0
 0
0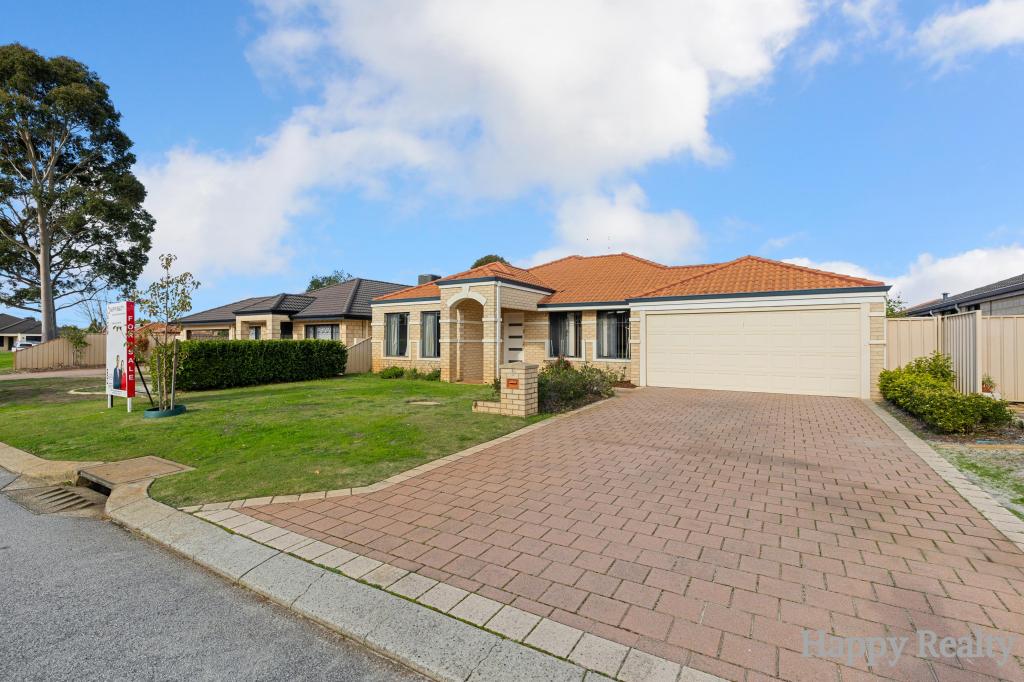 0
0Similar properties For Sale nearby
See more properties for sale nearby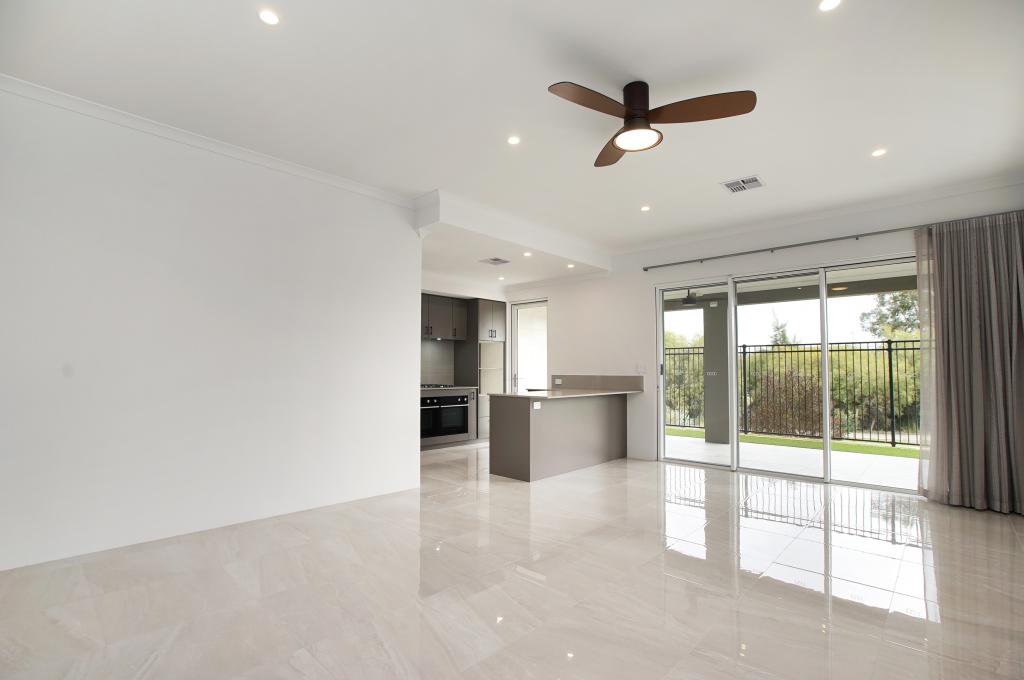 0
0
 0
0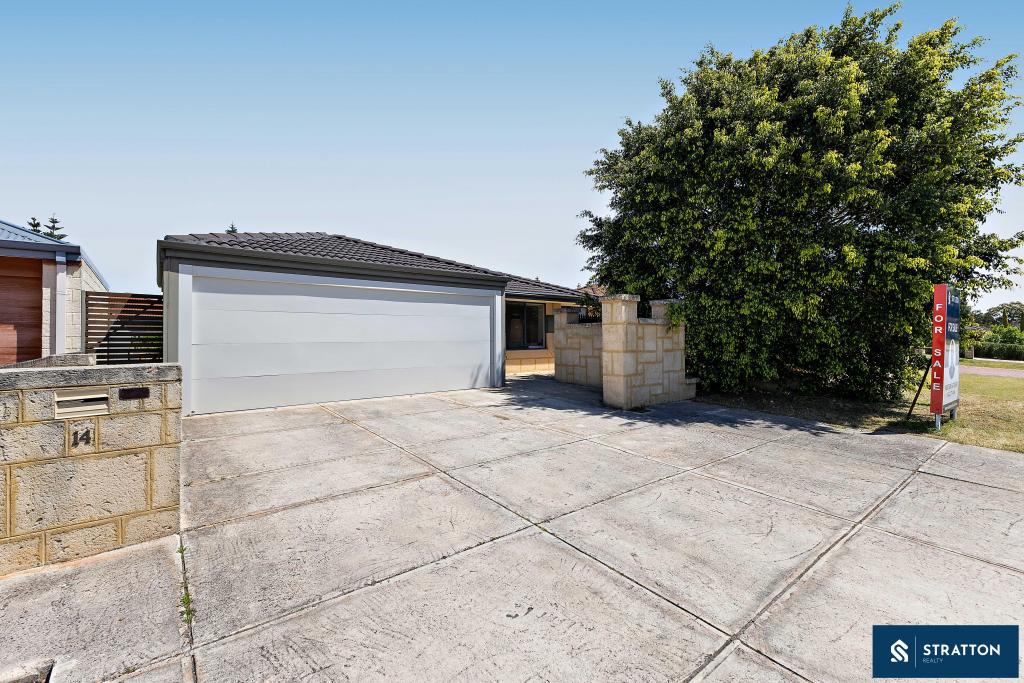 0
0Similar properties For Rent nearby
See more properties for rent nearby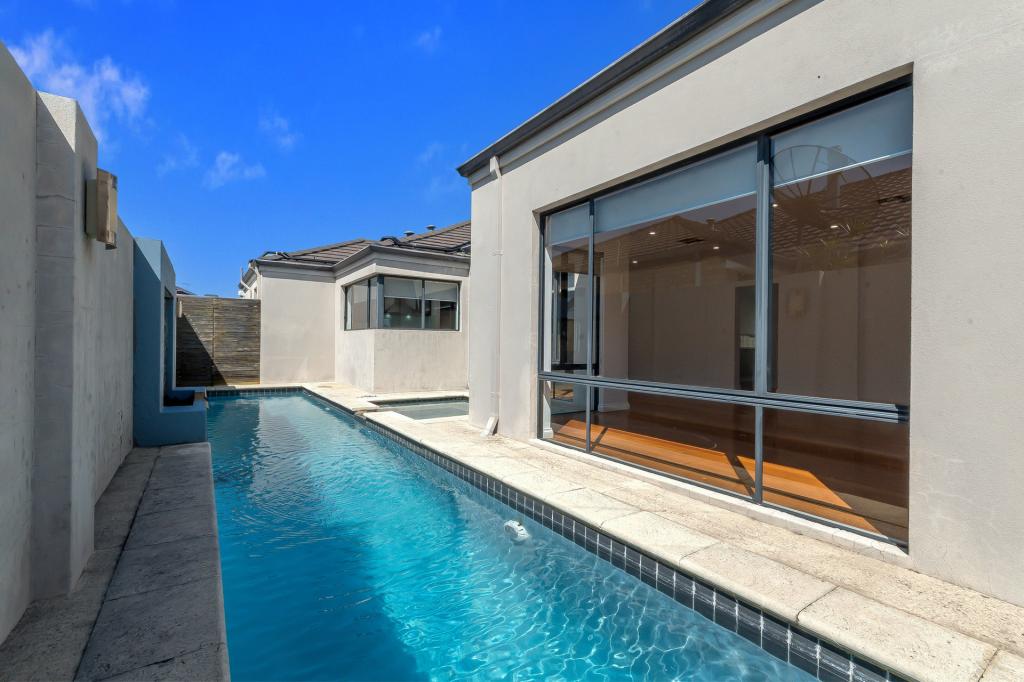 0
0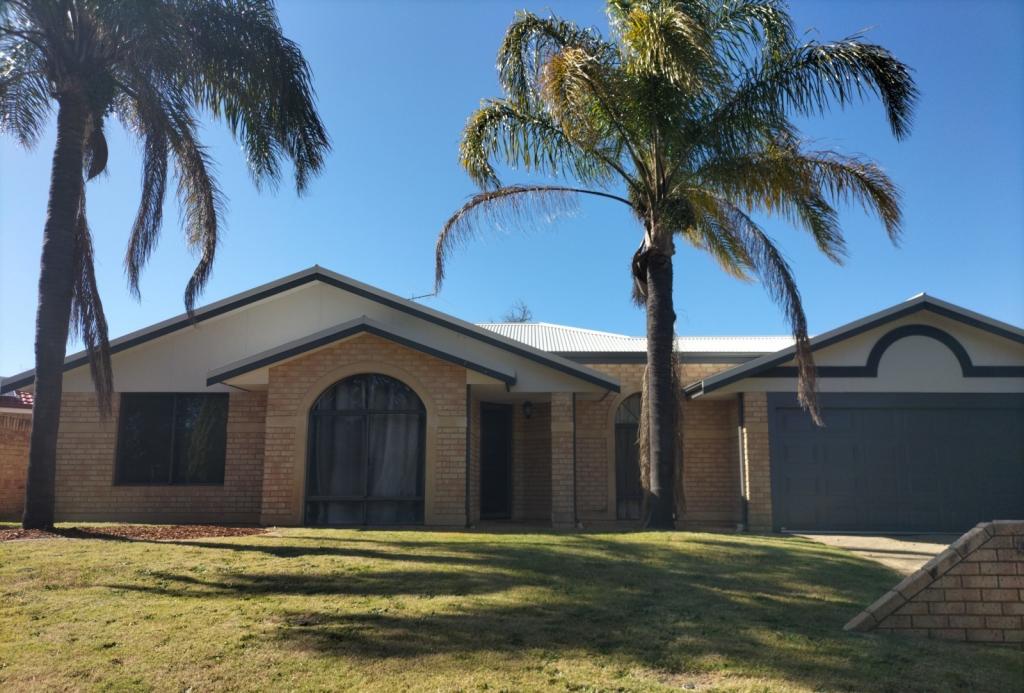 0
0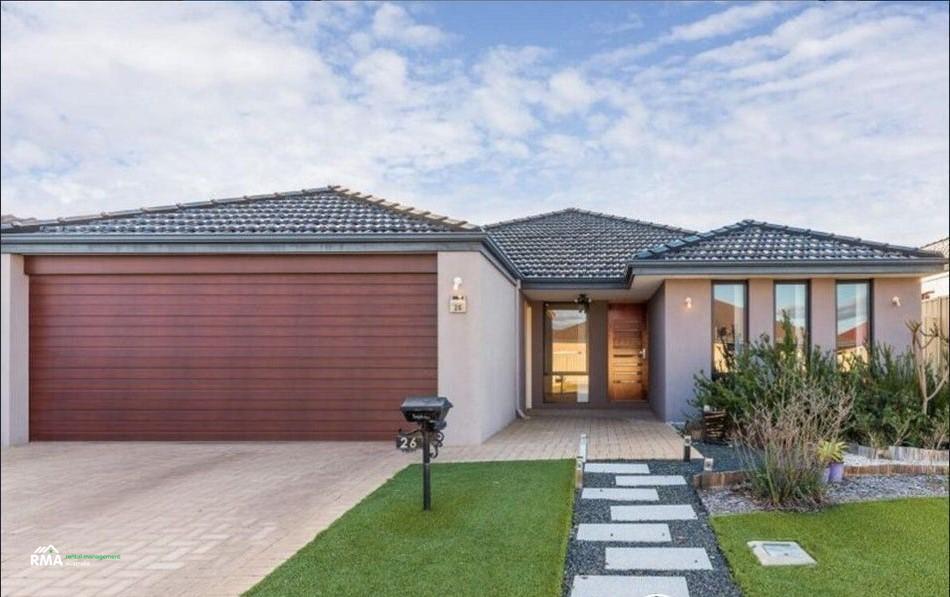 0
0About Canning Vale 6155
The size of Canning Vale is approximately 25.4 square kilometres. It has 71 parks covering nearly 17.1% of total area. The population of Canning Vale in 2011 was 30,665 people. By 2016 the population was 33,069 showing a population growth of 7.8% in the area during that time. The predominant age group in Canning Vale is 40-49 years. Households in Canning Vale are primarily couples with children and are likely to be repaying $1800 - $2399 per month on mortgage repayments. In general, people in Canning Vale work in a professional occupation. In 2011, 82.8% of the homes in Canning Vale were owner-occupied compared with 81% in 2016.
Canning Vale has 13,489 properties. Over the last 5 years, Houses in Canning Vale have seen a 81.82% increase in median value, while Units have seen a 80.66% increase. As at 31 August 2024:
- The median value for Houses in Canning Vale is $951,690 while the median value for Units is $571,991.
- Houses have a median rent of $750 while Units have a median rent of $595.
Suburb Insights for Canning Vale 6155
Market Insights
Canning Vale Trends for Houses
N/A
N/A
View TrendN/A
N/A
Canning Vale Trends for Units
N/A
N/A
View TrendN/A
N/A
Neighbourhood Insights
© Copyright 2024 RP Data Pty Ltd trading as CoreLogic Asia Pacific (CoreLogic). All rights reserved.
This product uses cookies and other similar technologies to improve and customise your browsing experience, to tailor content and adverts, and for analytics and metrics regarding visitor usage on this product and other media. We may share cookie and analytics information with third parties for the purposes of advertising. By continuing to use our website, you consent to cookies being used. View our Privacy Policy here.
X