57 Landy StreetMaffra VIC 3860
Property Details for 57 Landy St, Maffra
57 Landy St, Maffra is a 2 bedroom, 2 bathroom House with 1 parking spaces. The property has a land size of 507m2. While the property is not currently for sale or for rent, it was last sold in August 2024. There are 10 other 2 bedroom Houses sold in Maffra in the last 12 months.
Last Listing description (September 2024)
- Absolutely immaculate inside and out
- 1 bedroom townhouse
- Open plan kitchen/dining/family room
- Updated kitchen and bathroom
- Reverse cycle air conditioner
- Outstanding shed with shower, toilet, and laundry
- Man cave area with gas log fire and kitchenette option.
- Solar panels reducing cost of living expenses.
- Corner block measuring 506m2
- Perfect for those wanting to travel for months and come home to an easy to manage property.
Property History for 57 Landy St, Maffra, VIC 3860
- 09 Aug 2024Sold for $345,000
- 04 Jun 2024Listed for Sale $380,000
Recent sales nearby
See more recent sales nearbySimilar properties For Rent nearby
See more properties for rent nearby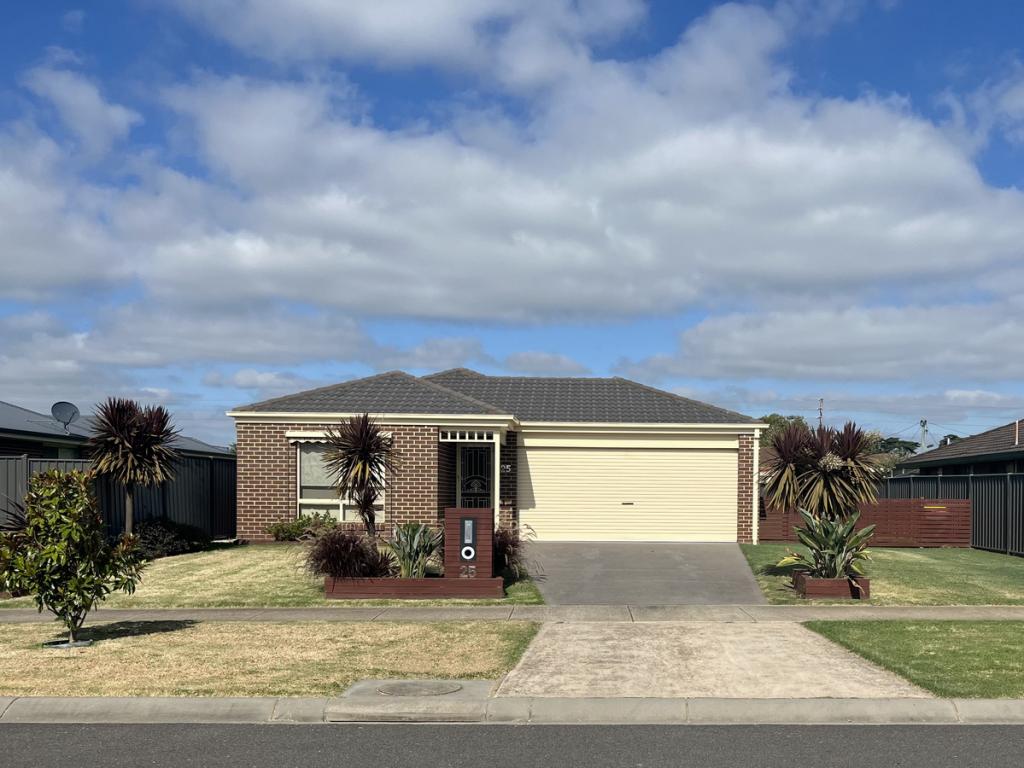

About Maffra 3860
The size of Maffra is approximately 82.4 square kilometres. It has 17 parks covering nearly 1.9% of total area. The population of Maffra in 2011 was 5,113 people. By 2016 the population was 5,264 showing a population growth of 3.0% in the area during that time. The predominant age group in Maffra is 50-59 years. Households in Maffra are primarily childless couples and are likely to be repaying $1000 - $1399 per month on mortgage repayments. In general, people in Maffra work in a trades occupation. In 2011, 72.7% of the homes in Maffra were owner-occupied compared with 72.8% in 2016.
Maffra has 1,516 properties. Over the last 5 years, Houses in Maffra have seen a 71.98% increase in median value, while Units have seen a 41.94% increase. As at 28 February 2025:
- The median value for Houses in Maffra is $420,476 while the median value for Units is $318,939.
- Houses have a median rent of $425 while Units have a median rent of $340.
What's around 57 Landy St, Maffra
57 Landy St, Maffra is in the school catchment zone for Maffra Secondary College and Maffra Primary School.


Suburb Insights for Maffra 3860
Market Insights
Maffra Trends for Houses
$420k
0.65%
View Trend$425/W
5.10%
Maffra Trends for Units
$319k
3.52%
View Trend$340/W
5.50%
Neighbourhood Insights
Age
Population 5,264
0-9
13%
10-19
12%
20-29
11%
30-39
11%
40-49
11%
50-59
13%
60-69
13%
70-79
9%
80-89
5%
90-99
1%
Household Structure
Occupancy
© Copyright 2025 RP Data Pty Ltd trading as CoreLogic Asia Pacific (CoreLogic). All rights reserved.
This product uses cookies and other similar technologies to improve and customise your browsing experience, to tailor content and adverts, and for analytics and metrics regarding visitor usage on this product and other media. We may share cookie and analytics information with third parties for the purposes of advertising. By continuing to use our website, you consent to cookies being used. View our Privacy Policy here.
X