2 Bramble CloseLyndhurst VIC 3975
Property Details for 2 Bramble Cl, Lyndhurst
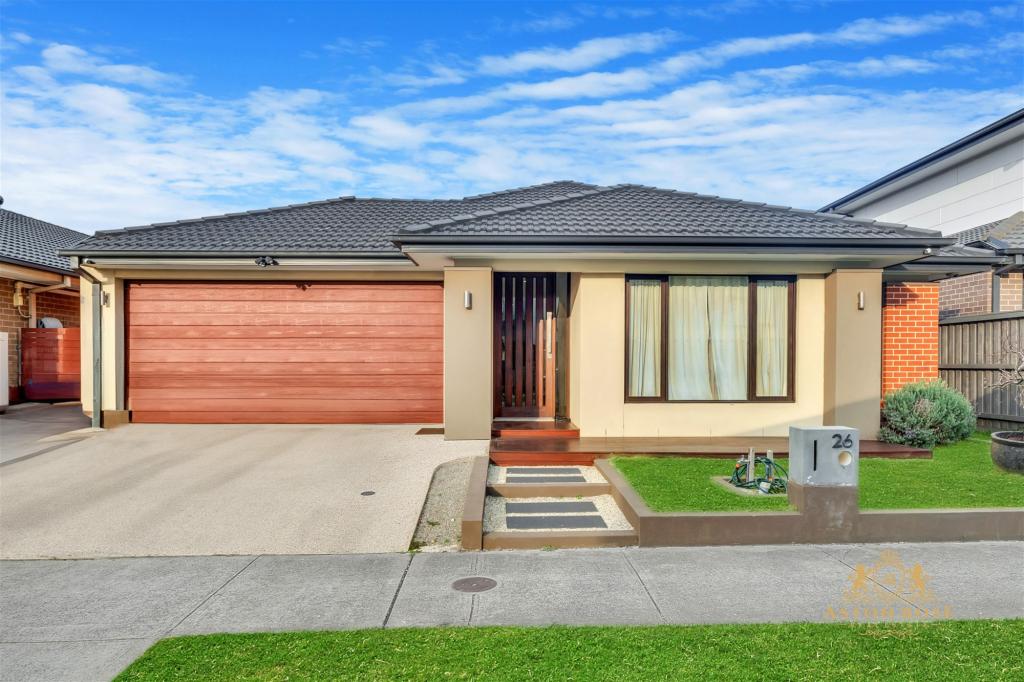
2 Bramble Cl, Lyndhurst is a 4 bedroom, 2 bathroom House with 2 parking spaces and was built in 2003. The property has a land size of 753m2 and floor size of 171m2. While the property is not currently for sale or for rent, it was last sold in September 2013.
Last Listing description (July 2023)
4 BEDROOM HOUSE IN LYNDHURST
This is a lovely family home in a great location.
-Master bedroom includes WIR & newly renovated en-suite.
-Open plan meals and family room
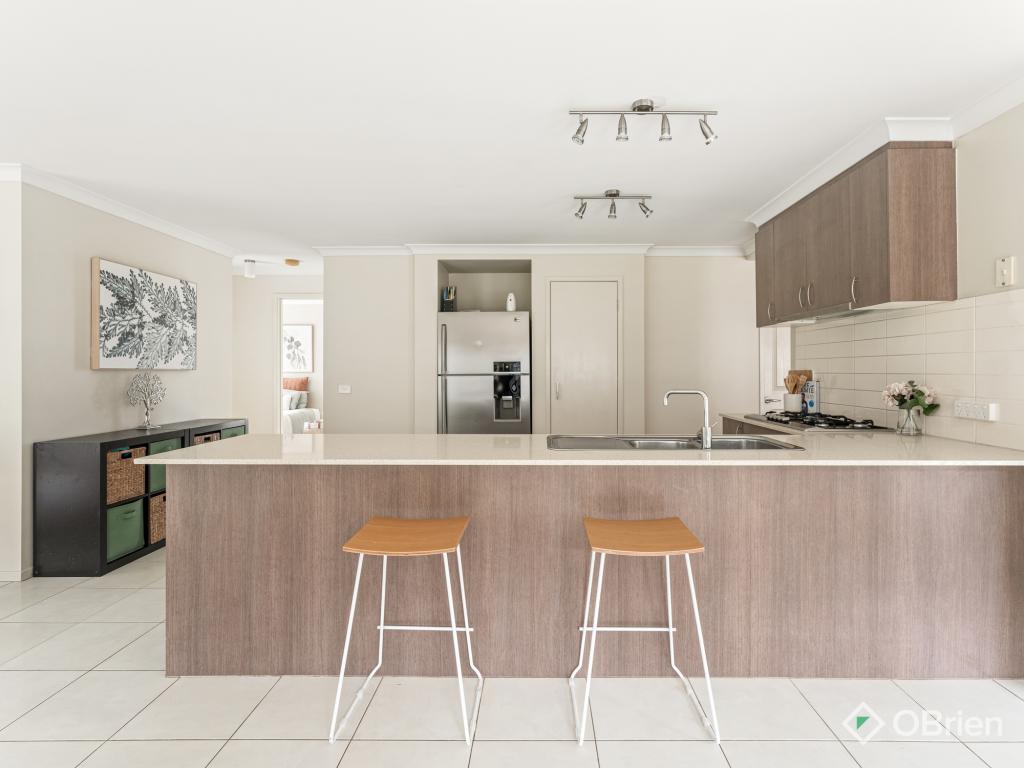
-Newly renovated kitchen with stainless steel appliances
-Newly renovated main bathroom
-Decked pergola area - great for entertaining !
-Ducted heating
-Evap cooling
-Double Garage
$610 per week / $2651 per month - THIS INCLUDES GARDENING
Property History for 2 Bramble Cl, Lyndhurst, VIC 3975
- 04 Jul 2023Listed for Rent $610 / week
- 27 Jan 2021Listed for Rent $440 / week
- 09 Nov 2017Listed for Rent - Price not available
Commute Calculator
Recent sales nearby
See more recent sales nearby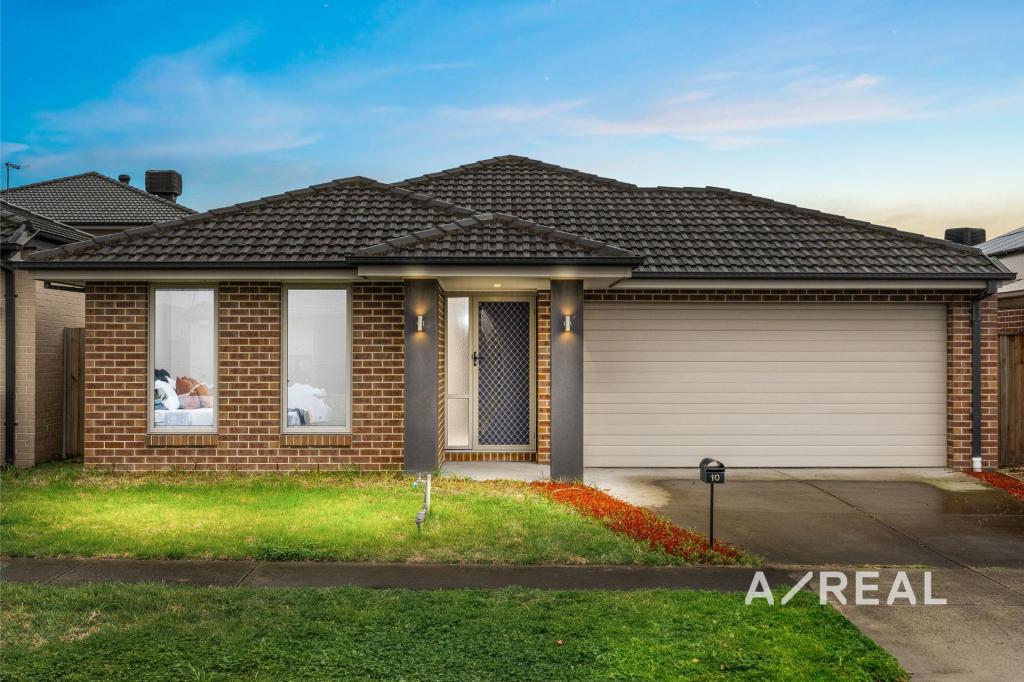 0
0
 0
0
 0
0
Similar properties For Sale nearby
See more properties for sale nearby 0
0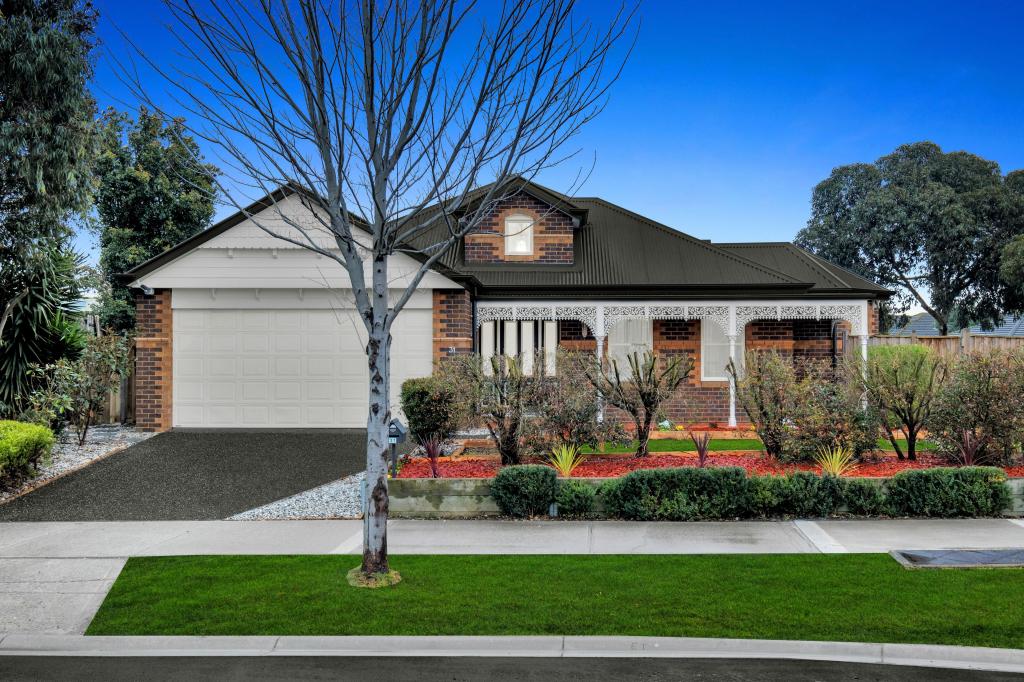 0
0 0
0Similar properties For Rent nearby
See more properties for rent nearby 0
0 0
0
 0
0About Lyndhurst 3975
The size of Lyndhurst is approximately 9.3 square kilometres. It has 17 parks covering nearly 3.5% of total area. The population of Lyndhurst in 2011 was 4,896 people. By 2016 the population was 6,702 showing a population growth of 36.9% in the area during that time. The predominant age group in Lyndhurst is 30-39 years. Households in Lyndhurst are primarily couples with children and are likely to be repaying $1800 - $2399 per month on mortgage repayments. In general, people in Lyndhurst work in a professional occupation. In 2011, 84.4% of the homes in Lyndhurst were owner-occupied compared with 81.2% in 2016.
Lyndhurst has 3,273 properties. Over the last 5 years, Houses in Lyndhurst have seen a 41.81% increase in median value, while Units have seen a 37.32% increase. As at 31 August 2024:
- The median value for Houses in Lyndhurst is $928,281 while the median value for Units is $589,955.
- Houses have a median rent of $625 while Units have a median rent of $480.
Suburb Insights for Lyndhurst 3975
Market Insights
Lyndhurst Trends for Houses
N/A
N/A
View TrendN/A
N/A
Lyndhurst Trends for Units
N/A
N/A
View TrendN/A
N/A
Neighbourhood Insights
© Copyright 2024 RP Data Pty Ltd trading as CoreLogic Asia Pacific (CoreLogic). All rights reserved.
This product uses cookies and other similar technologies to improve and customise your browsing experience, to tailor content and adverts, and for analytics and metrics regarding visitor usage on this product and other media. We may share cookie and analytics information with third parties for the purposes of advertising. By continuing to use our website, you consent to cookies being used. View our Privacy Policy here.
X