139 Boland DriveLyndhurst VIC 3975
Property Details for 139 Boland Dr, Lyndhurst
139 Boland Dr, Lyndhurst is a 4 bedroom, 2 bathroom House with 2 parking spaces and was built in 2012. The property has a land size of 586m2 and floor size of 234m2. While the property is not currently for sale or for rent, it was last sold in April 2009.
Last Listing description (January 2017)
Boasting luxury fixtures and fitting and immaculate surrounds, this near new home is sure to impress! Featuring master at year of house, complete with walk in robe and ensuite with double vanities, while other bedrooms have built in robes and ducted heating throughout. Other stunning features include open study, rumpus room perfect for a kids' retreat, large living area and theatre room. The open plan kitchen and dining area boasts gas stove and double oven, plus dishwasher. Outdoors features landscaped gardens, decked alfresco with in-floor lighting and double remote garage with rear access. Inspect today!
Property History for 139 Boland Dr, Lyndhurst, VIC 3975
- 22 Nov 2016Listed for Rent $102 / week
- 19 May 2015Listed for Rent - Price not available
- 30 Jan 2013Listed for Rent - Price not available
Commute Calculator
Recent sales nearby
See more recent sales nearby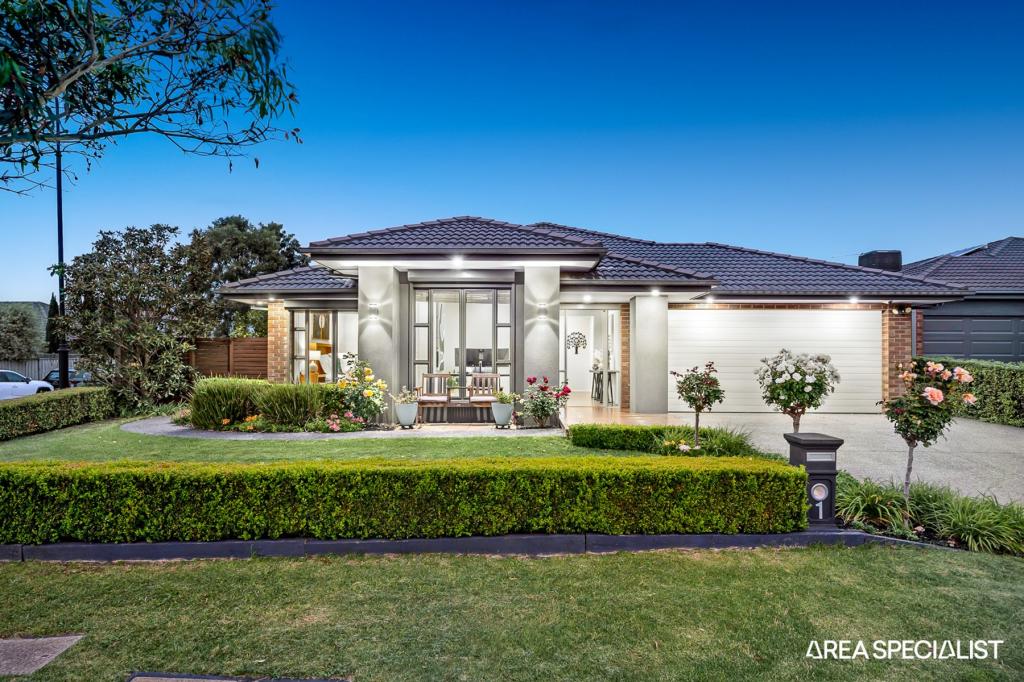 0
0 0
0Similar properties For Sale nearby
See more properties for sale nearby 0
0
 0
0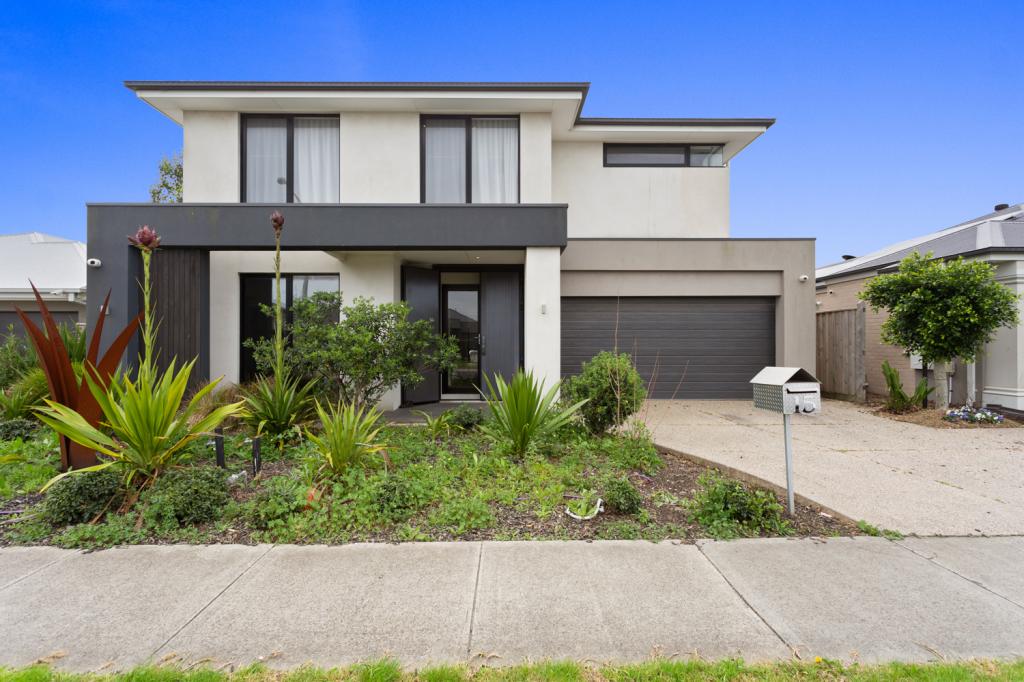 0
0Similar properties For Rent nearby
See more properties for rent nearby 0
0 0
0 0
0About Lyndhurst 3975
The size of Lyndhurst is approximately 9.3 square kilometres. It has 17 parks covering nearly 3.5% of total area. The population of Lyndhurst in 2011 was 4,896 people. By 2016 the population was 6,702 showing a population growth of 36.9% in the area during that time. The predominant age group in Lyndhurst is 30-39 years. Households in Lyndhurst are primarily couples with children and are likely to be repaying $1800 - $2399 per month on mortgage repayments. In general, people in Lyndhurst work in a professional occupation. In 2011, 84.4% of the homes in Lyndhurst were owner-occupied compared with 81.2% in 2016.
Lyndhurst has 3,269 properties. Over the last 5 years, Houses in Lyndhurst have seen a 37.68% increase in median value, while Units have seen a 22.89% increase. As at 31 October 2024:
- The median value for Houses in Lyndhurst is $930,741 while the median value for Units is $557,141.
- Houses have a median rent of $630 while Units have a median rent of $490.
Suburb Insights for Lyndhurst 3975
Market Insights
Lyndhurst Trends for Houses
N/A
N/A
View TrendN/A
N/A
Lyndhurst Trends for Units
N/A
N/A
View TrendN/A
N/A
Neighbourhood Insights
© Copyright 2024 RP Data Pty Ltd trading as CoreLogic Asia Pacific (CoreLogic). All rights reserved.
This product uses cookies and other similar technologies to improve and customise your browsing experience, to tailor content and adverts, and for analytics and metrics regarding visitor usage on this product and other media. We may share cookie and analytics information with third parties for the purposes of advertising. By continuing to use our website, you consent to cookies being used. View our Privacy Policy here.
X