11 Billabong CourtBurnside VIC 3023
Property Details for 11 Billabong Ct, Burnside
11 Billabong Ct, Burnside is a 4 bedroom, 2 bathroom House with 2 parking spaces and was built in 2004. The property has a land size of 726m2 and floor size of 181m2. While the property is not currently for sale or for rent, it was last sold in February 2017.
Last Listing description (June 2017)
Designed with a strong emphasis on open plan living, this single level home is ideal for anyone with a growing family. Comprises: 4 spacious bedrooms (master boasting WIR and en-suite), formal living area, kitchen boasting stainless steel appliances, adjacent dining area, large rumpus room and family area. Heating/cooling, garage with drive through access, massive back yard. Perfectly located only a short stroll to natural parklands and only a moments' drive to Burnside Shopping Centre.
All of this on an allotment of 725m2 (Approx.)
Property History for 11 Billabong Ct, Burnside, VIC 3023
- 17 Feb 2017Sold for $548,000
- 07 Feb 2017Listed for Sale $520,000-$540,000
- 06 Apr 2007Listed for Rent - Price not available
Commute Calculator
Recent sales nearby
See more recent sales nearby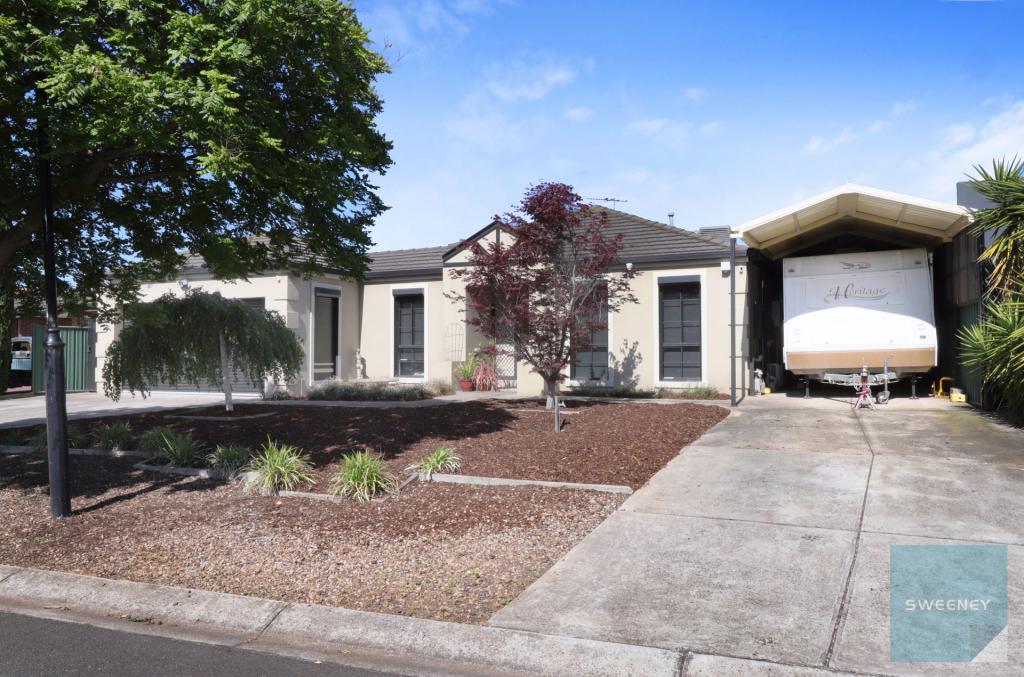 0
0Similar properties For Sale nearby
See more properties for sale nearby 0
0 0
0 0
0Similar properties For Rent nearby
See more properties for rent nearby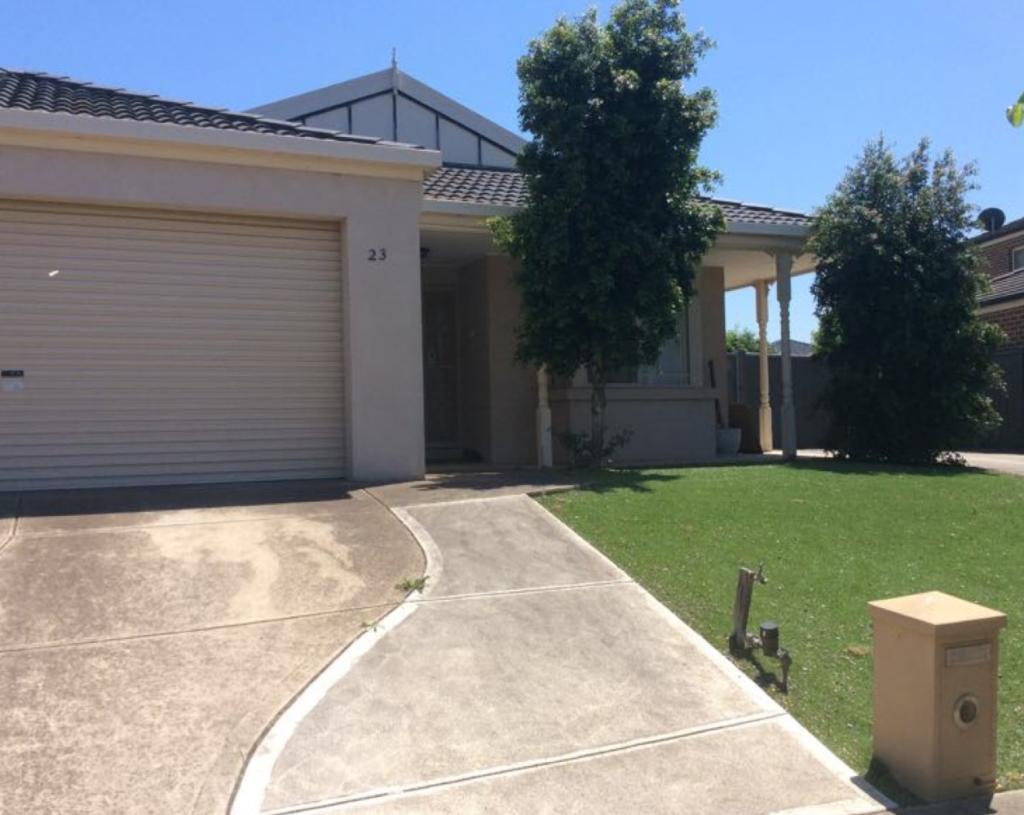 0
0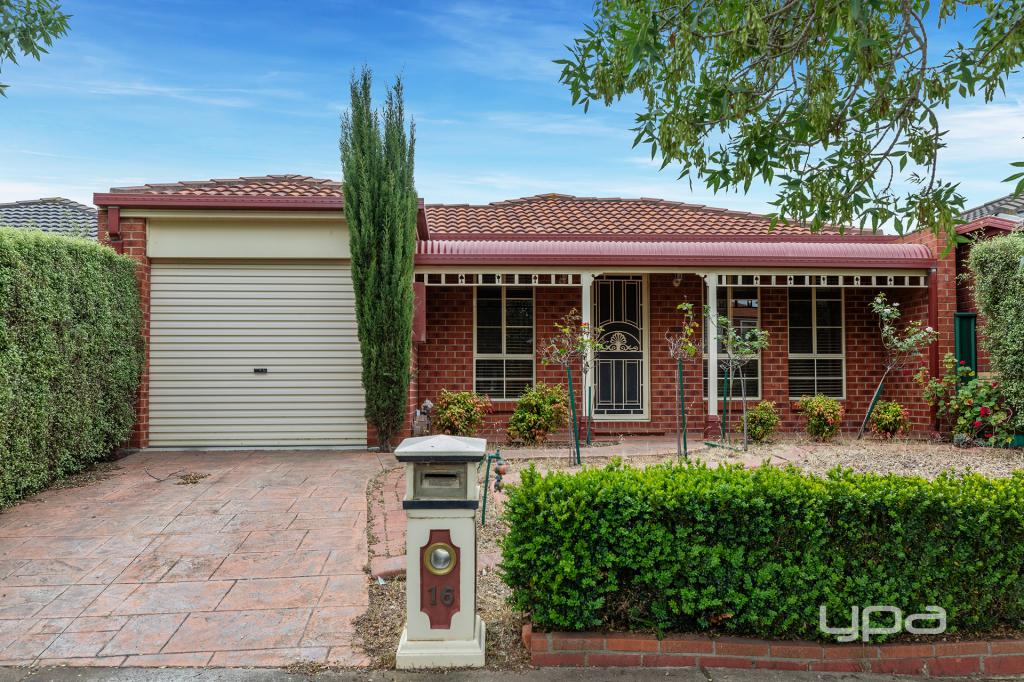 0
0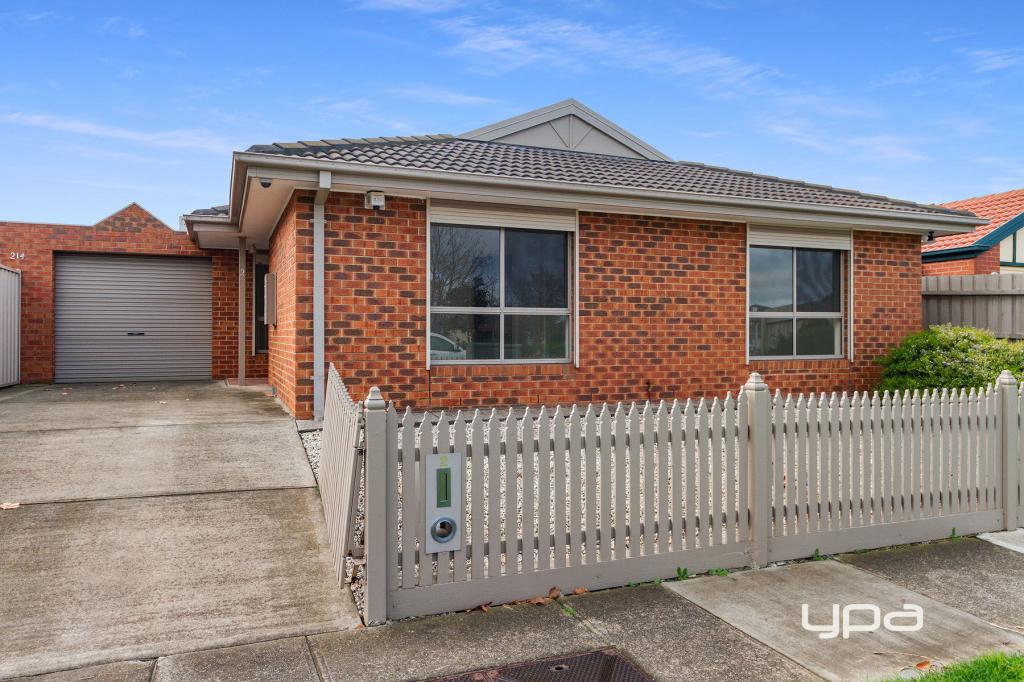 0
0About Burnside 3023
The size of Burnside is approximately 2.5 square kilometres. It has 13 parks covering nearly 10.5% of total area. The population of Burnside in 2011 was 4,385 people. By 2016 the population was 4,761 showing a population growth of 8.6% in the area during that time. The predominant age group in Burnside is 40-49 years. Households in Burnside are primarily couples with children and are likely to be repaying $1800 - $2399 per month on mortgage repayments. In general, people in Burnside work in a labourer occupation. In 2011, 81.5% of the homes in Burnside were owner-occupied compared with 83.5% in 2016.
Burnside has 2,489 properties. Over the last 5 years, Houses in Burnside have seen a 21.68% increase in median value, while Units have seen a -3.21% decrease. As at 30 November 2024:
- The median value for Houses in Burnside is $769,180 while the median value for Units is $541,863.
- Houses have a median rent of $550.
Suburb Insights for Burnside 3023
Market Insights
Burnside Trends for Houses
N/A
N/A
View TrendN/A
N/A
Burnside Trends for Units
N/A
N/A
View TrendN/A
N/A
Neighbourhood Insights
© Copyright 2024 RP Data Pty Ltd trading as CoreLogic Asia Pacific (CoreLogic). All rights reserved.
This product uses cookies and other similar technologies to improve and customise your browsing experience, to tailor content and adverts, and for analytics and metrics regarding visitor usage on this product and other media. We may share cookie and analytics information with third parties for the purposes of advertising. By continuing to use our website, you consent to cookies being used. View our Privacy Policy here.
X