1A Cherrill StreetBurnley VIC 3121
Property Details for 1a Cherrill St, Burnley
1a Cherrill St, Burnley is a 2 bedroom, 2 bathroom Townhouse with 1 parking spaces and was built in 2014. The property has a land size of 91m2 and floor size of 113m2. While the property is not currently for sale or for rent, it was last sold in September 2011.
Last Listing description (November 2011)
AFFORDABLE AND LOW MAINTENANCE
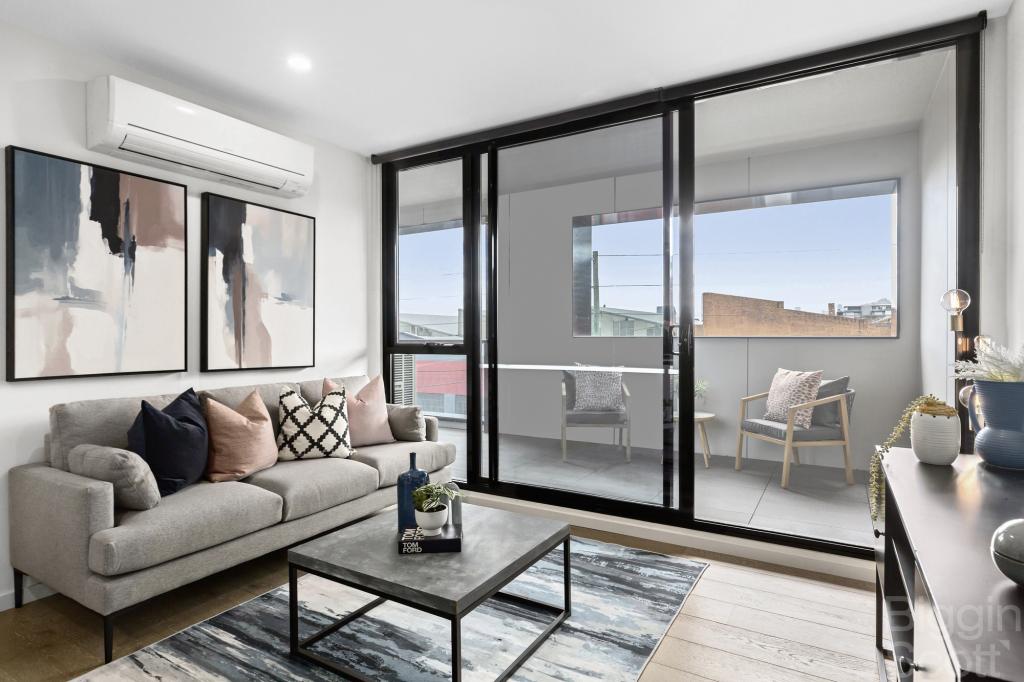
TOWN RESIDENCE-GREAT POSITION - 2 LARGE BEDROOMS - BIR'S - SEPARATE MEZZANINE STUDY -BALCONY - OPEN PLAN LIVING AND DINING - TIDY KITCHEN WITH AMPLE CUPBOARD SPACE - 2 BATHROOMS- ENSUITE TO MAIN - NORTH-FACING COURTYARD - HIGHLY SOUGHT AFTER LOCK-UP GARAGE WIDE QUIET STREET WITH PARK, GOLF COURSE AND TRANSPORT ONLY MOMENTS AWAY! **PLEASE CONFIRM TIME ON DAY OF OPEN ON INTERNET** JULIE TAYLOR : 0439 859 811
Property History for 1a Cherrill St, Burnley, VIC 3121
- 12 Nov 2011Listed for Sale $650,000 - $690,000
- 03 Sep 2011Sold for $690,000
- 13 Aug 2011Listed for Sale ESTIMATED SELLING RANGE $600,000 - $650,000
Commute Calculator
Recent sales nearby
See more recent sales nearbySimilar properties For Sale nearby
See more properties for sale nearby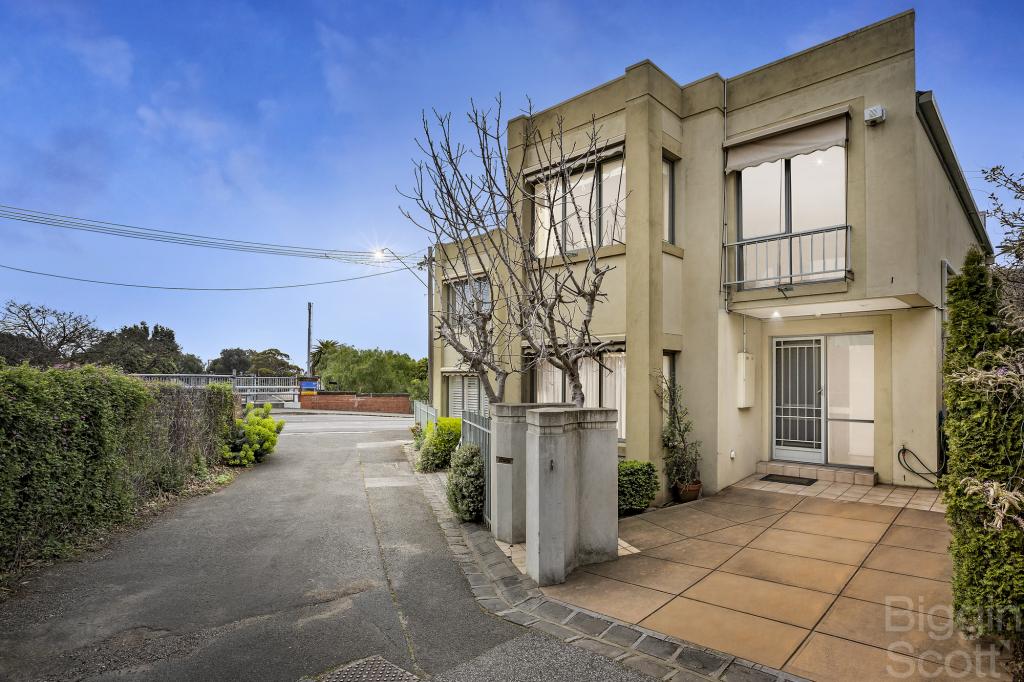 0
0
 0
0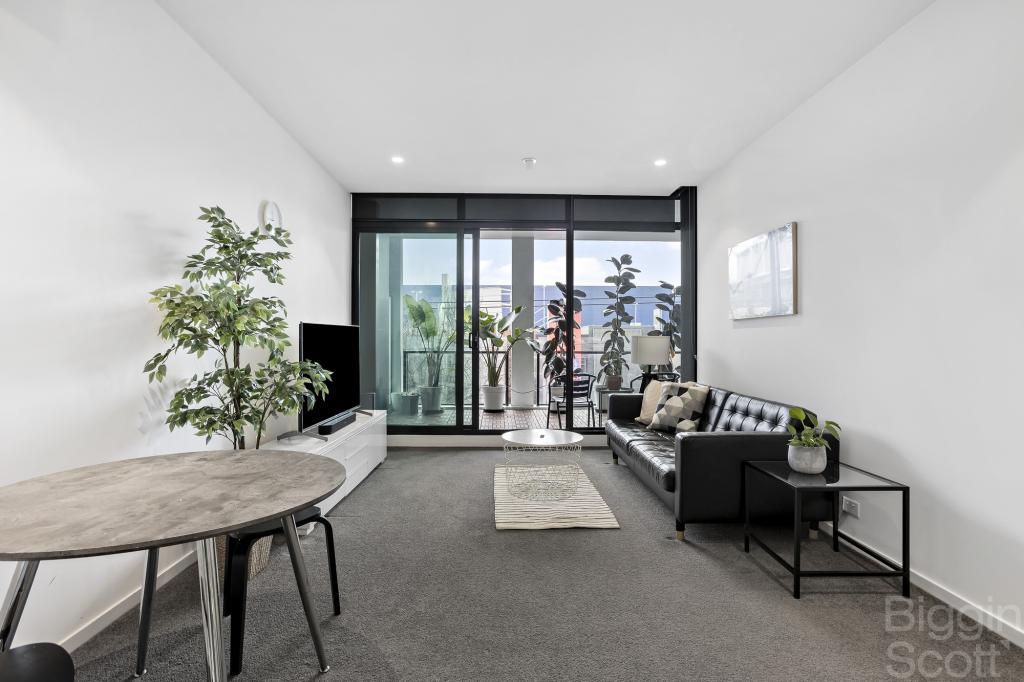 0
0Similar properties For Rent nearby
See more properties for rent nearby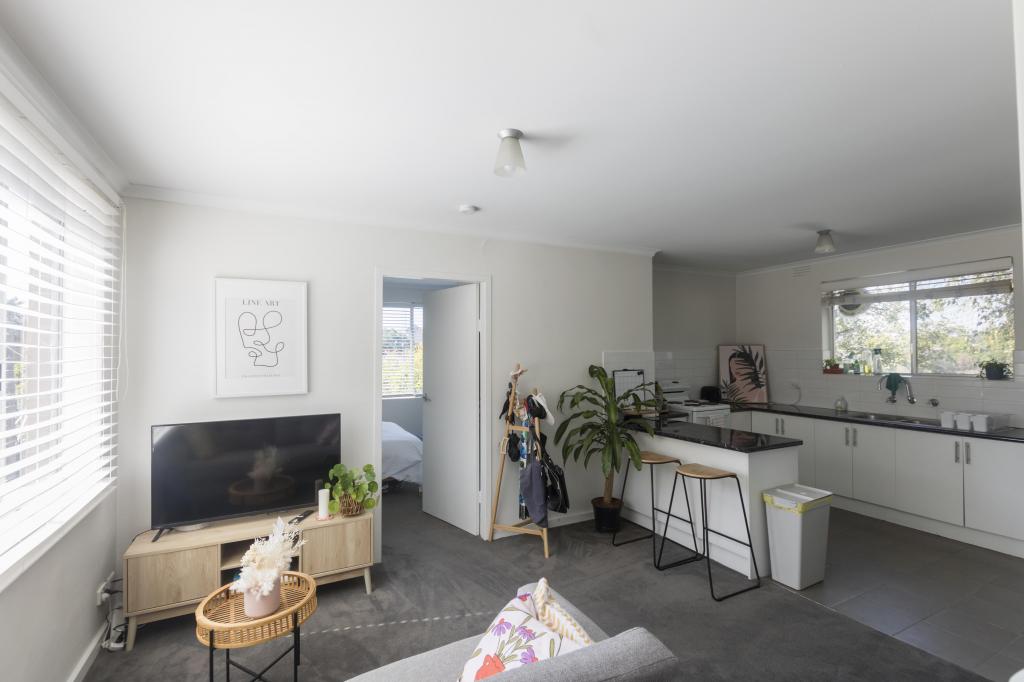 0
0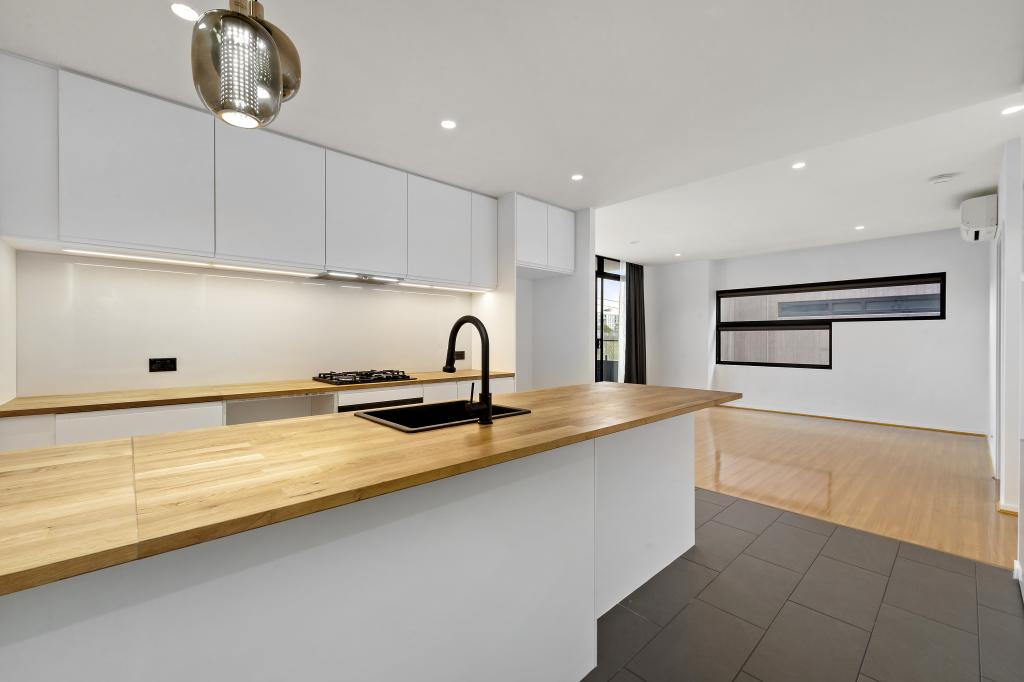 0
0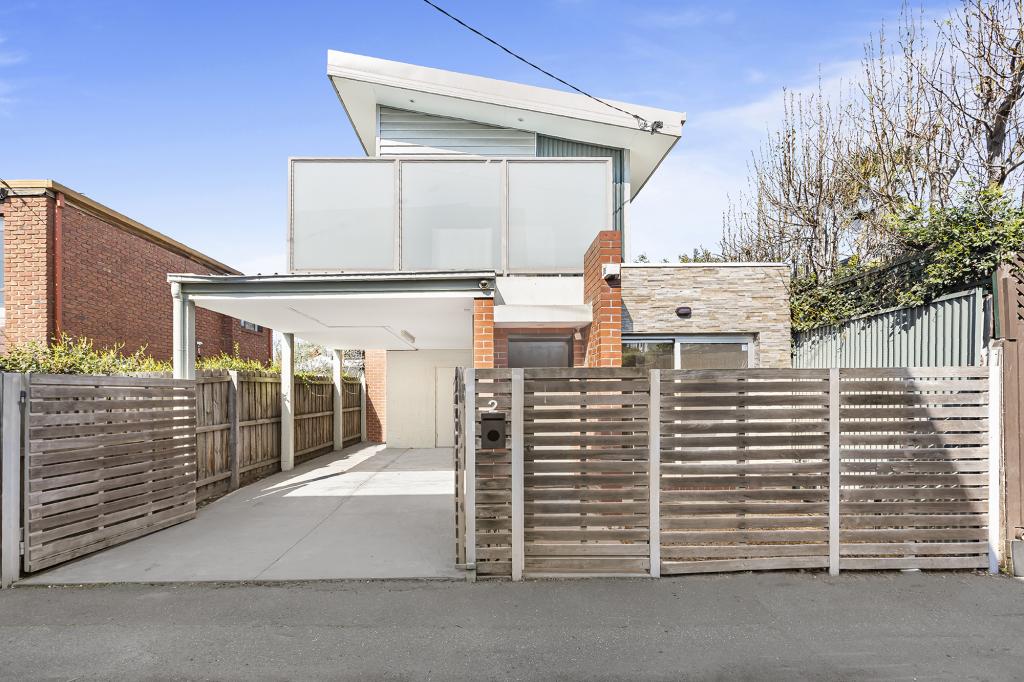 0
0About Burnley 3121
The size of Burnley is approximately 1.1 square kilometres. It has 6 parks covering nearly 48.9% of total area. The population of Burnley in 2011 was 738 people. By 2016 the population was 791 showing a population growth of 7.2% in the area during that time. The predominant age group in Burnley is 20-29 years. Households in Burnley are primarily childless couples and are likely to be repaying $2400 - $2999 per month on mortgage repayments. In general, people in Burnley work in a professional occupation. In 2011, 48.6% of the homes in Burnley were owner-occupied compared with 48.5% in 2016.
Burnley has 642 properties. Over the last 5 years, Houses in Burnley have seen a 26.78% increase in median value, while Units have seen a 0.30% increase. As at 31 August 2024:
- The median value for Houses in Burnley is $1,488,923 while the median value for Units is $664,489.
- Houses have a median rent of $900 while Units have a median rent of $470.
Suburb Insights for Burnley 3121
Market Insights
Burnley Trends for Houses
N/A
N/A
View TrendN/A
N/A
Burnley Trends for Units
N/A
N/A
View TrendN/A
N/A
Neighbourhood Insights
© Copyright 2024 RP Data Pty Ltd trading as CoreLogic Asia Pacific (CoreLogic). All rights reserved.
This product uses cookies and other similar technologies to improve and customise your browsing experience, to tailor content and adverts, and for analytics and metrics regarding visitor usage on this product and other media. We may share cookie and analytics information with third parties for the purposes of advertising. By continuing to use our website, you consent to cookies being used. View our Privacy Policy here.
X