159 Colby DriveBelgrave South VIC 3160
Property Details for 159 Colby Dr, Belgrave South
159 Colby Dr, Belgrave South is a 4 bedroom, 1 bathroom House with 2 parking spaces and was built in 1966. The property has a land size of 2220m2 and floor size of 160m2. While the property is not currently for sale or for rent, it was last sold in August 2008.
Last Listing description (August 2008)
SAVE ON PETROL!!!
WALKING DISTANCE TO SHOPS, SCHOOLS, SUPERMARKET, DOCTORS, SPORTING FACILITIES & PUBLIC TRANSPORT YOU CAN SAVE ON PETROL COSTS AND ONLY 10 MINUTES (APPROX) TO FOUNTAIN GATE SHOPPING CENTRE. SET ON OVER HALF AN ACRE IS A GREAT FAMILY HOME WITH 4 BEDROOMS + STUDY, DOUBLE CARPORT, GDH, SLOW COMBUSTION HEATER WITH COOKTOP, HARDWOOD AND SLATE FLOORING PLUS AIR CONDITIONING. THE HOME OFFERS THE OPPORTUNITY FOR SELF CONTAINED ACCOMMODATION OR HOME OFFICE WITH SEPARATE ENTRANCE. THE GARDEN HAS BEAUTIFUL ESTABLISHED TREES, MAGNIFICENT TREE FERNS AND NATURAL BUSH, ENSURING PRIVACY. THE REAR YARD HAS A BUNGALOW/WORKSHOP AND PLENTY OF ROOM FOR THE KIDS TO KICK A FOOTY OR PLAY CRICKET.
ADDITIONAL FEATURE - STUDY.
Property History for 159 Colby Dr, Belgrave South, VIC 3160
- 16 Aug 2008Sold for $330,000
- 04 May 2008Listed for Sale $340,000+
Commute Calculator
Recent sales nearby
See more recent sales nearby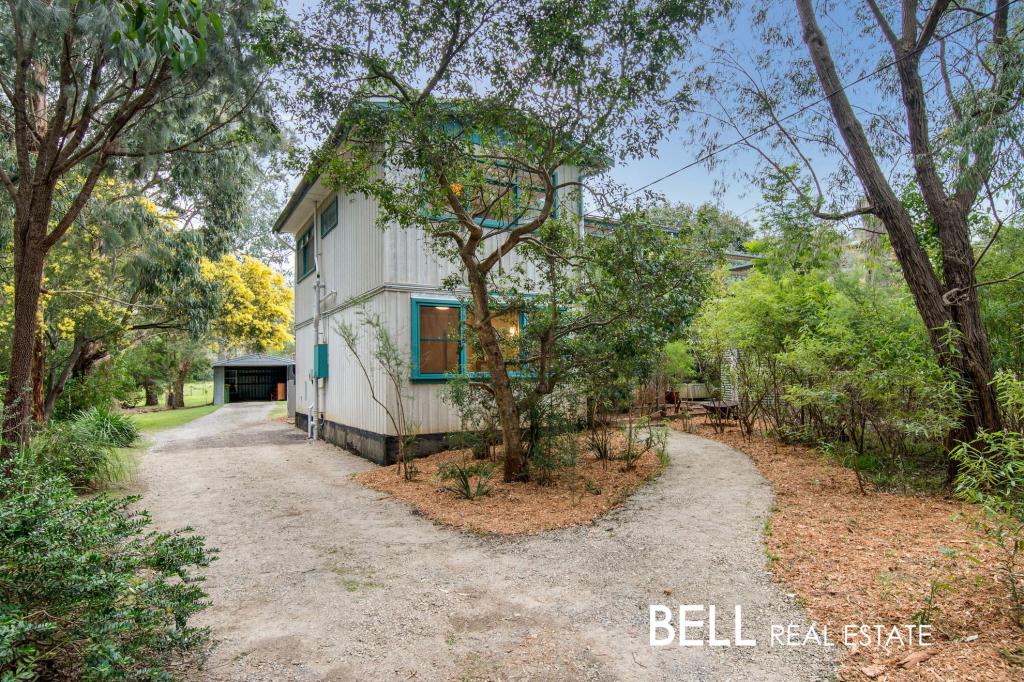 0
0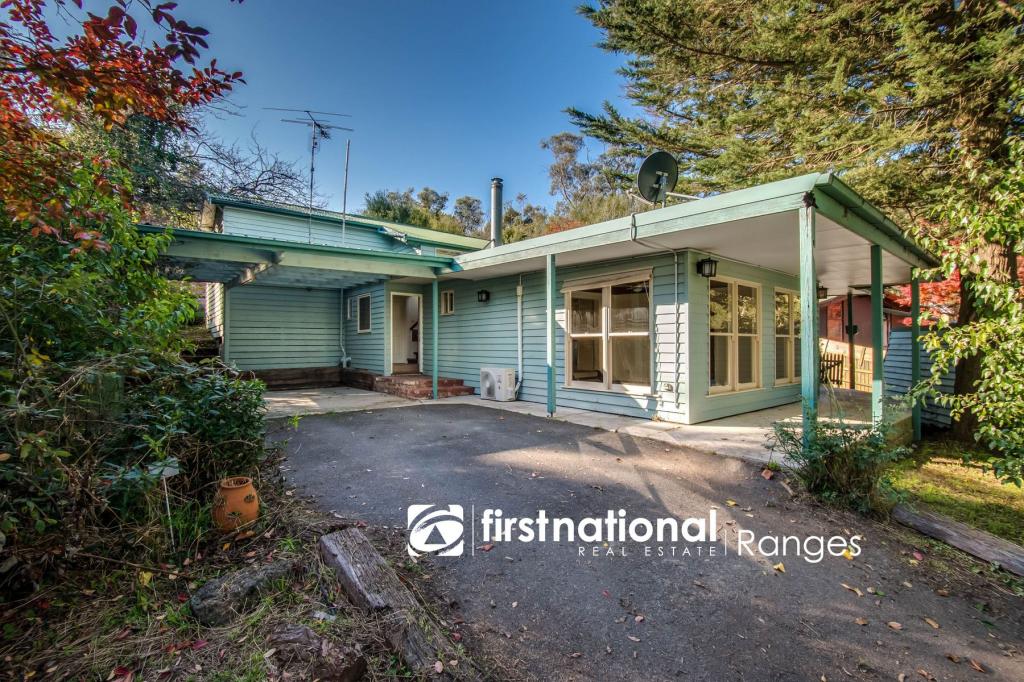 0
0
Similar properties For Sale nearby
See more properties for sale nearby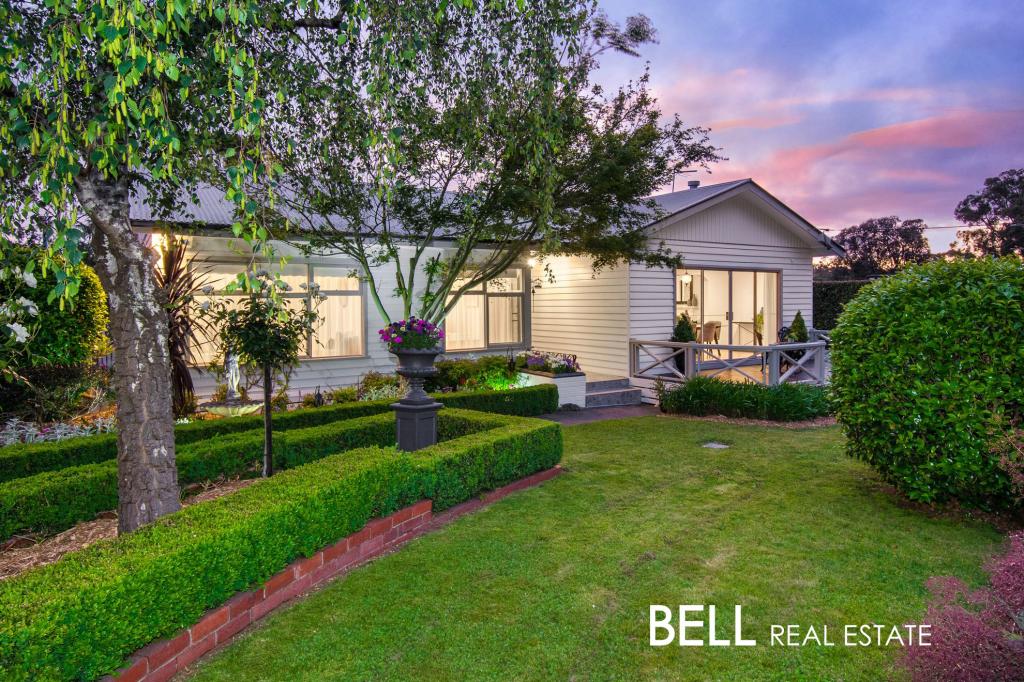 0
0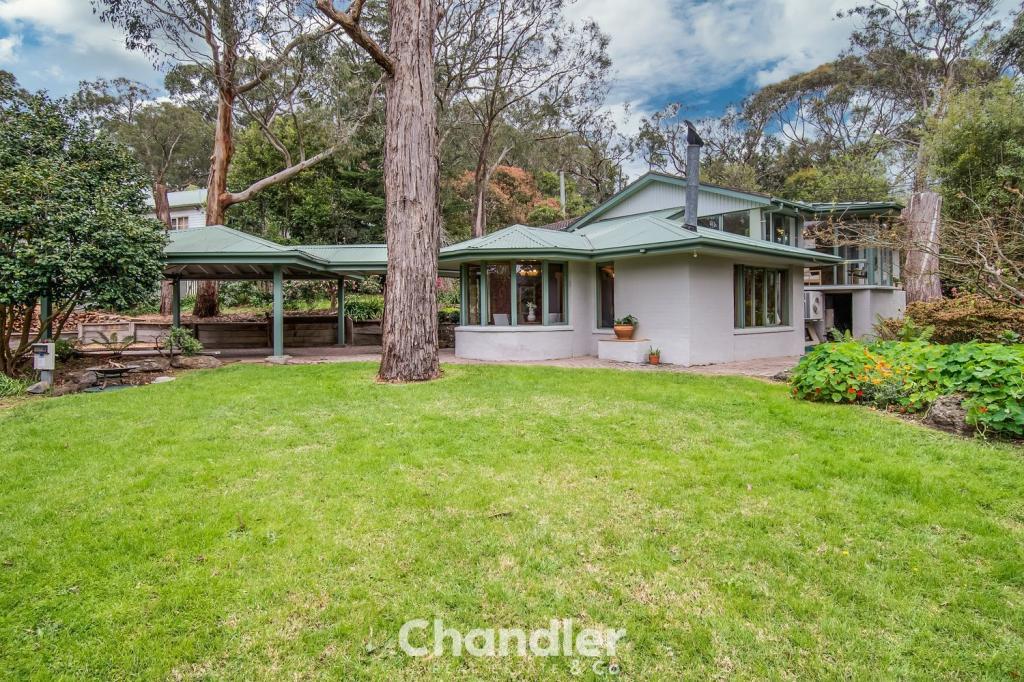 0
0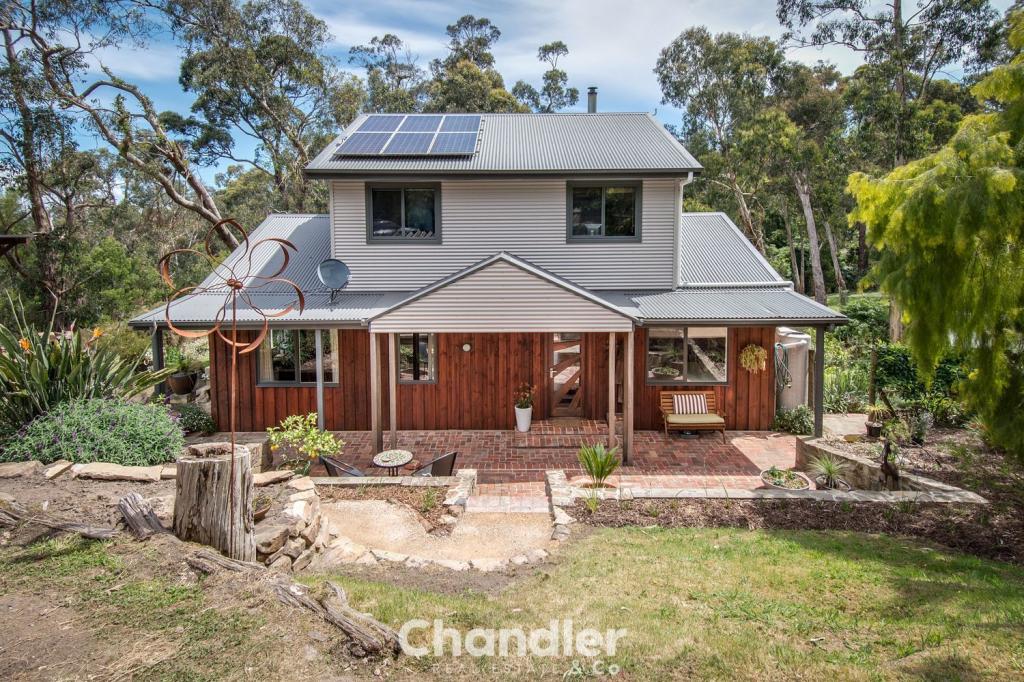 0
0Similar properties For Rent nearby
See more properties for rent nearby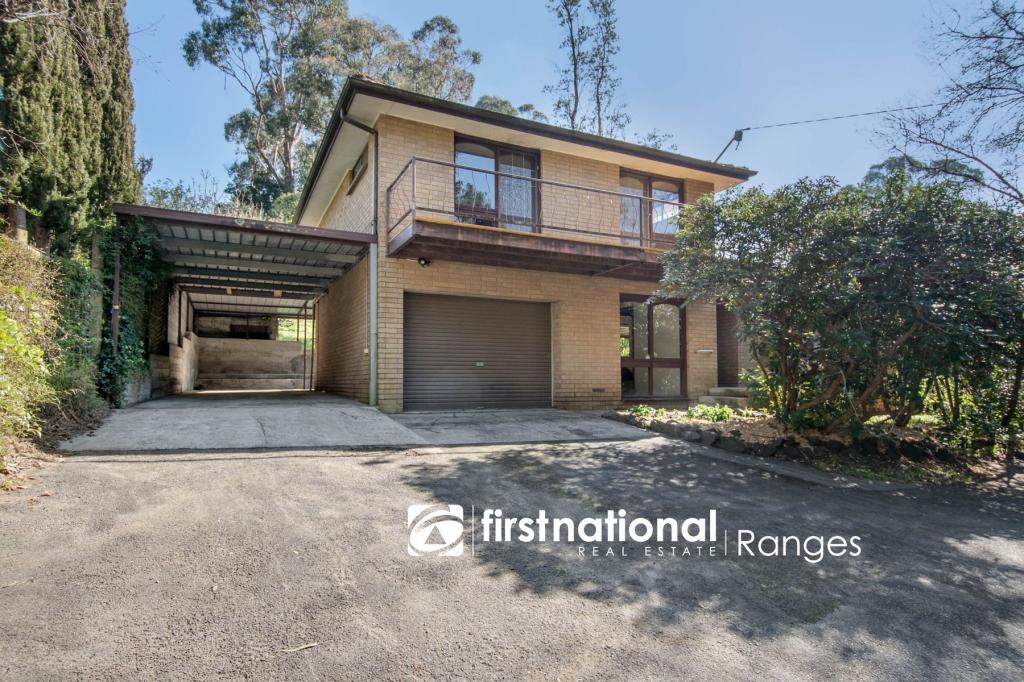 0
0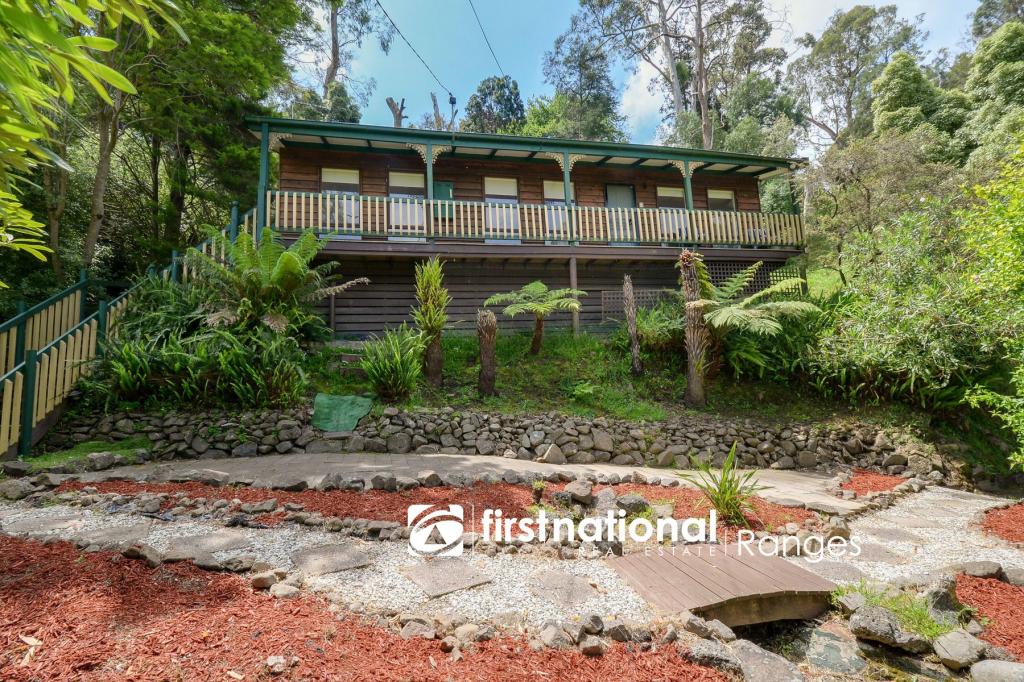 0
0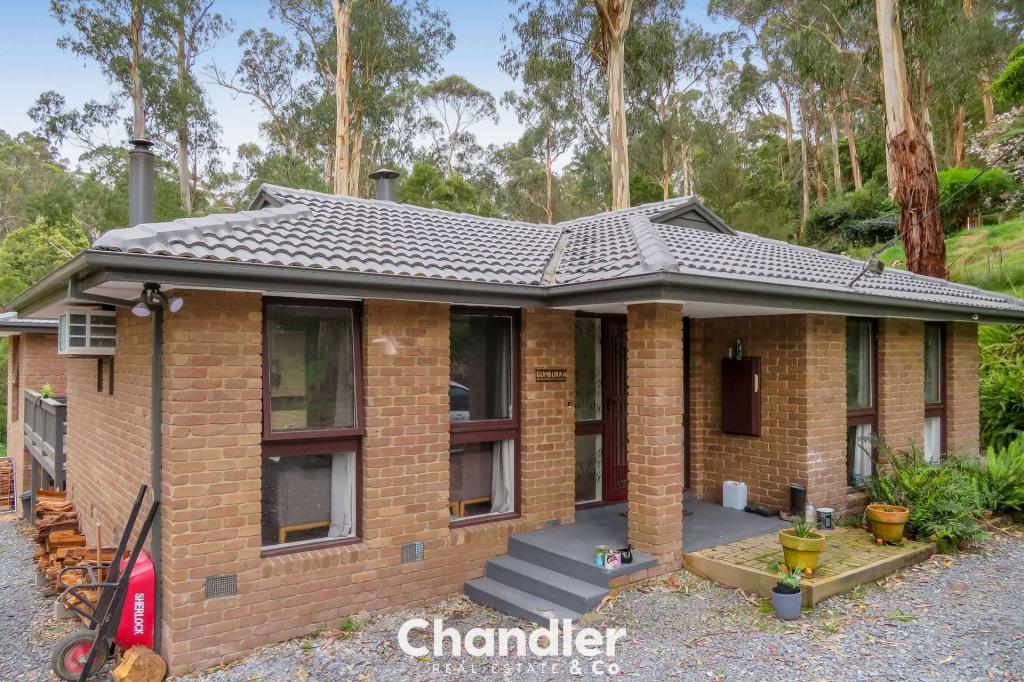 0
0About Belgrave South 3160
The size of Belgrave South is approximately 12.6 square kilometres. It has 13 parks covering nearly 7.1% of total area. The population of Belgrave South in 2011 was 1,661 people. By 2016 the population was 1,654 showing a population decline of 0.4% in the area during that time. The predominant age group in Belgrave South is 50-59 years. Households in Belgrave South are primarily couples with children and are likely to be repaying $1800 - $2399 per month on mortgage repayments. In general, people in Belgrave South work in a trades occupation. In 2011, 89.5% of the homes in Belgrave South were owner-occupied compared with 90.8% in 2016.
Belgrave South has 636 properties. Over the last 5 years, Houses in Belgrave South have seen a 37.36% increase in median value. As at 30 November 2024:
- The median value for Houses in Belgrave South is $1,115,269 while the median value for Units is $762,939.
- Houses have a median rent of $395.
Suburb Insights for Belgrave South 3160
Market Insights
Belgrave South Trends for Houses
N/A
N/A
View TrendN/A
N/A
Belgrave South Trends for Units
N/A
N/A
View TrendN/A
N/A
Neighbourhood Insights
© Copyright 2024 RP Data Pty Ltd trading as CoreLogic Asia Pacific (CoreLogic). All rights reserved.
This product uses cookies and other similar technologies to improve and customise your browsing experience, to tailor content and adverts, and for analytics and metrics regarding visitor usage on this product and other media. We may share cookie and analytics information with third parties for the purposes of advertising. By continuing to use our website, you consent to cookies being used. View our Privacy Policy here.
X