45 Best StreetBelgrave VIC 3160
Property Details for 45 Best St, Belgrave
45 Best St, Belgrave is a 3 bedroom, 1 bathroom House with 2 parking spaces and was built in 1940. The property has a land size of 855m2 and floor size of 143m2. While the property is not currently for sale or for rent, it was last sold in November 2009.
Last Listing description (January 2010)
BEST BUY - UNDER OFFER
THE BUZZ WORD IN REAL ESTATE IS LOCATION, LOCATION, LOCATION, WHEN YOU INSPECT THIS CHARACTER FILLED COTTAGE, NOT ONLY WILL YOU FALL IN LOVE WITH ITS CHARM BUT ALSO ITS LOCATION & PROXIMITY TO EVERYTHING YOU DESIRE, WHICH IS SURE TO MAKE YOU THE TALK OF THE TOWN. THE HOME AFFORDS TWO SEPARATE LIVING AREAS FOR INFORMAL & FORMAL ENTERTAINING, BOTH WITH WOOD HEATERS ONE OPEN, ONE COONARA, NEW KITCHEN WITH QUALITY FITTINGS AND COMPLETE WITH BEAUTIFUL VISTAS, ENJOY A TRADITIONAL SUMMER BBQ ON THE REAR DECK WHILE THE KIDS RUN AROUND THE LEVEL REAR GARDEN.
THE HOME IS FINISHED WITH GAS DUCTED HEATING, AIR CONDITIONING & A DOUBLE CARPORT.
MAKE SURE YOU INSPECT THIS CLASSIC.
ADDITIONAL FEATURE - NORTH ASPECT; FULLY FENCED; PRIVATE VIEWS; 2 OFFSTREET PARKING; PUBLIC TRANSPORT: CLOSE BY; PATIO.
Property History for 45 Best St, Belgrave, VIC 3160
- 30 Nov 2009Sold for $405,000
- 22 Nov 2009Listed for Sale NEG. OVER $370,000
- 21 Oct 1994Sold for $116,000
Commute Calculator
Recent sales nearby
See more recent sales nearby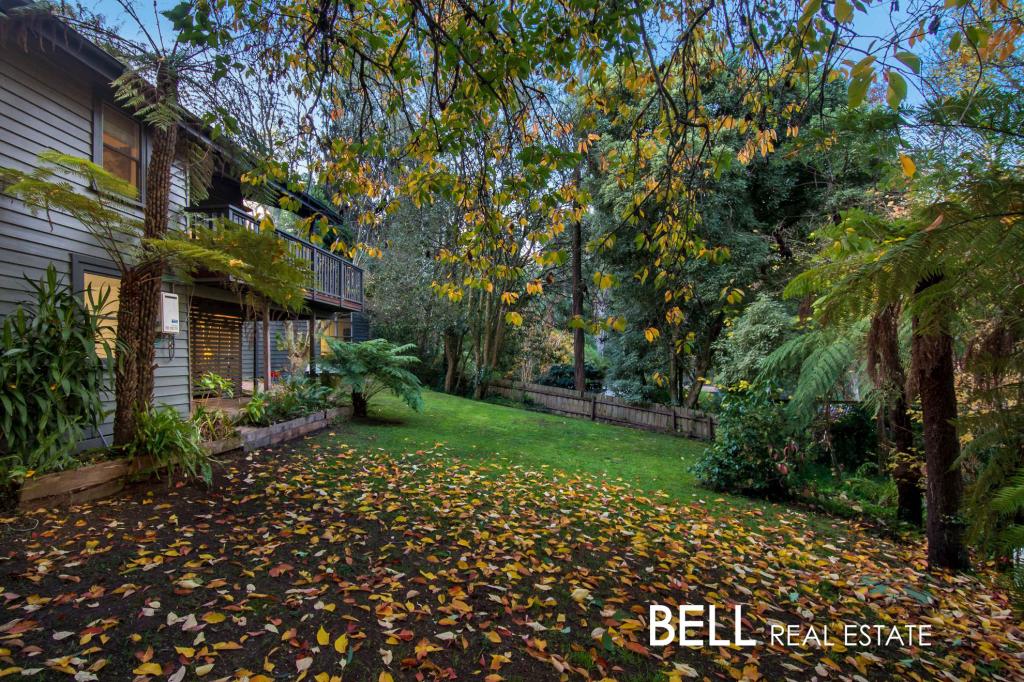 0
0Similar properties For Sale nearby
See more properties for sale nearby 0
0 0
0 0
0About Belgrave 3160
The size of Belgrave is approximately 4.2 square kilometres. It has 15 parks covering nearly 20.4% of total area. The population of Belgrave in 2011 was 3,966 people. By 2016 the population was 3,935 showing a population decline of 0.8% in the area during that time. The predominant age group in Belgrave is 40-49 years. Households in Belgrave are primarily couples with children and are likely to be repaying $1800 - $2399 per month on mortgage repayments. In general, people in Belgrave work in a professional occupation. In 2011, 86.6% of the homes in Belgrave were owner-occupied compared with 87.8% in 2016.
Belgrave has 1,780 properties.
Suburb Insights for Belgrave 3160
Market Insights
Trends for Houses
N/A
N/A
View TrendN/A
N/A
Trends for Units
N/A
N/A
View TrendN/A
N/A
Neighbourhood Insights
© Copyright 2024 RP Data Pty Ltd trading as CoreLogic Asia Pacific (CoreLogic). All rights reserved.
This product uses cookies and other similar technologies to improve and customise your browsing experience, to tailor content and adverts, and for analytics and metrics regarding visitor usage on this product and other media. We may share cookie and analytics information with third parties for the purposes of advertising. By continuing to use our website, you consent to cookies being used. View our Privacy Policy here.
X