43 Benson StreetBelgrave VIC 3160
Property Details for 43 Benson St, Belgrave
43 Benson St, Belgrave is a 5 bedroom, 2 bathroom House with 1 parking spaces and was built in 1945. The property has a land size of 1034m2 and floor size of 108m2. While the property is not currently for sale or for rent, it was last sold in January 2010.
Last Listing description (January 2010)
THREE BEDROOM HOME WITH TWO BUNGALOWS & MASSIVE POTENTIAL
HERE IS THE CHANCE FOR THAT GROWING FAMILY OR AN ASTUTE BUYER TO SECURE A PROPERTY WITH PLENTY OF ROOM & AMAZING POTENTIAL. THE MAIN HOUSE HAS THREE BEDROOMS ALL WITH BIR'S, & MANY ORIGINAL PERIOD FEATURES INCLUDING ORNATE CORNERS & PICTURE RAILS, AS WELL AS A RENOVATED BATHROOM, BRIGHT KITCHEN, ENCLOSED PORCH/ENTERTAINING AREA, GAS HEATING & SPLIT SYSTEM. THIS PROPERTY IN ADDITION HAS THE RARE BONUS OF TWO BUNGALOWS - ONE WITH ENSUITE & KITCHEN SINK,
THE OTHER WITH BEDROOM & LOUNGE. THE FENCED, FLAT BACKYARD HAS A LARGE IN-GROUND SWIMMING POOL WITH NEW FENCING & FILTER & ALL THIS IS PERFECTLY POSITIONED WITHIN WALKING DISTANCE TO BELGRAVE'S PUBLIC TRANSPORT & SHOPS. WITH A BIT OF WORK THIS PROPERTY COULD BE RESTORED TO ITS FORMER GLORY & BE SOMETHING VERY SPECIAL.
Property History for 43 Benson St, Belgrave, VIC 3160
- 06 Jan 2010Sold for $335,000
- 18 Dec 2009Listed for Sale $310,000 - $350,000
Commute Calculator
Recent sales nearby
See more recent sales nearby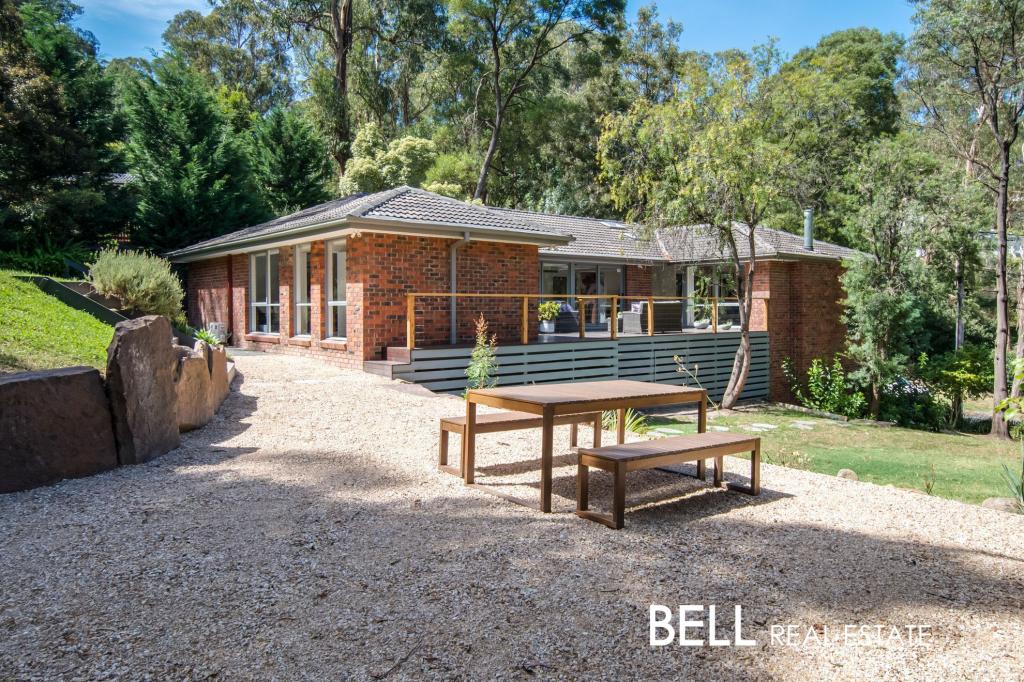 0
0 0
0
 0
0Similar properties For Sale nearby
See more properties for sale nearby 0
0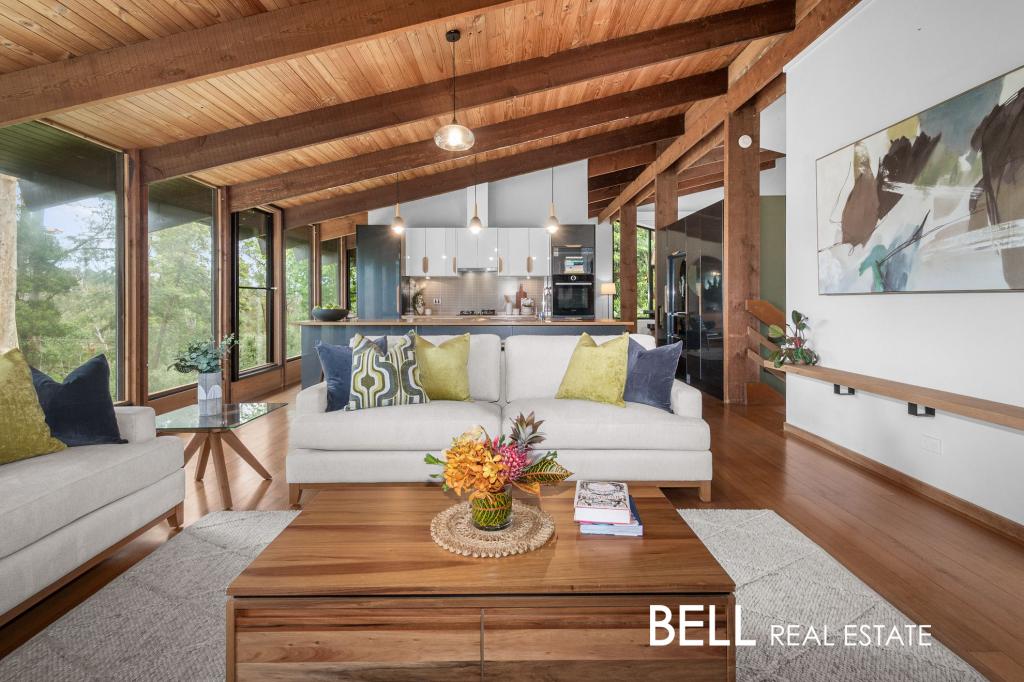 0
0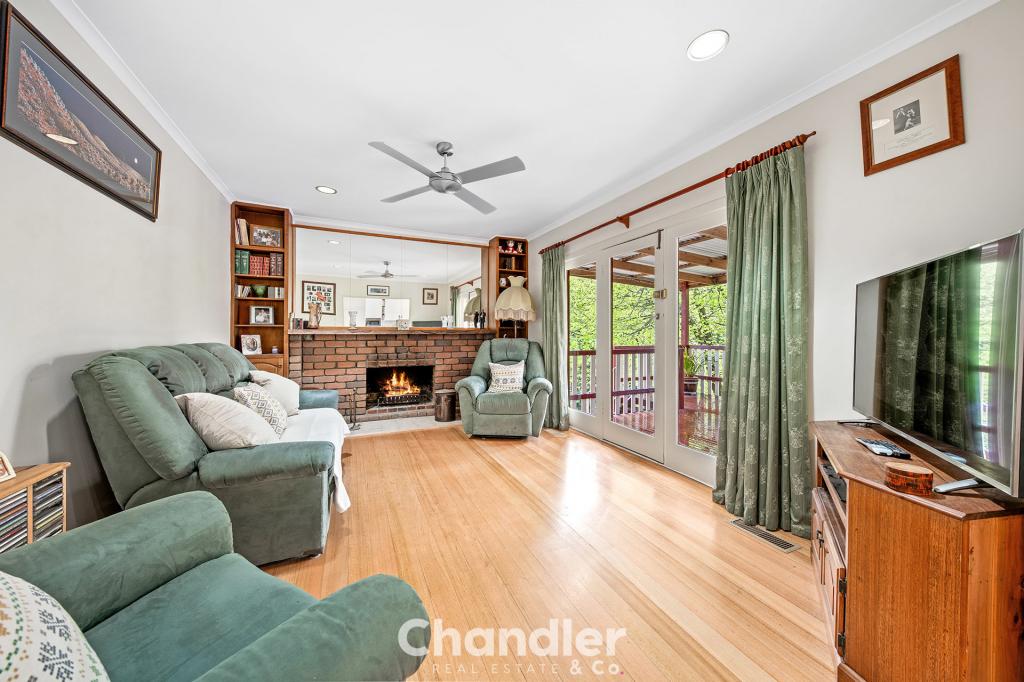 0
0Similar properties For Rent nearby
See more properties for rent nearby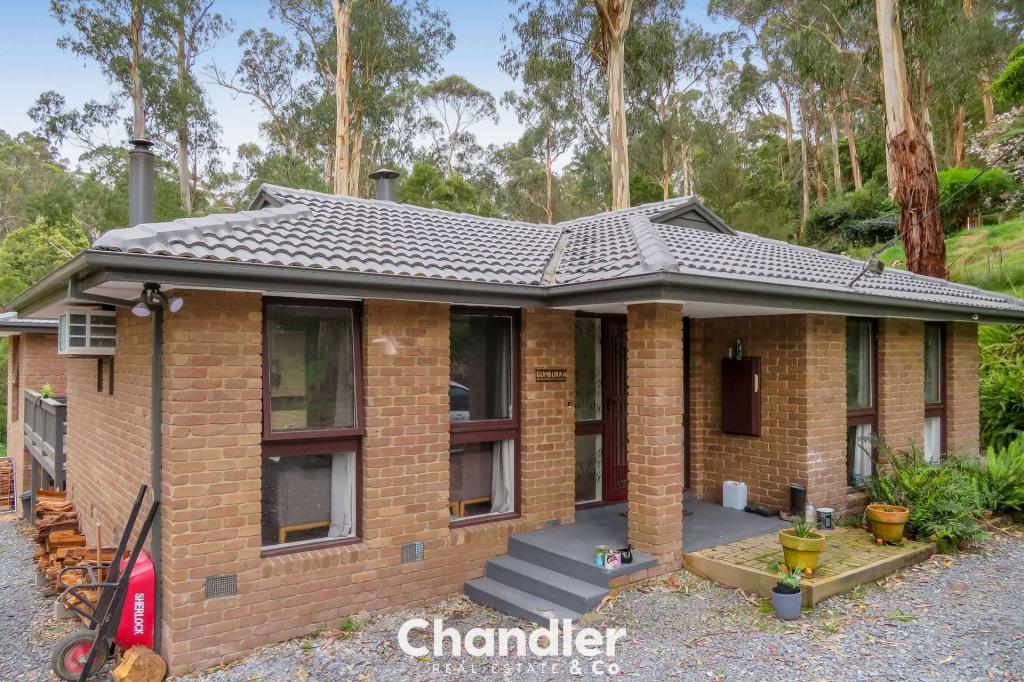 0
0 0
0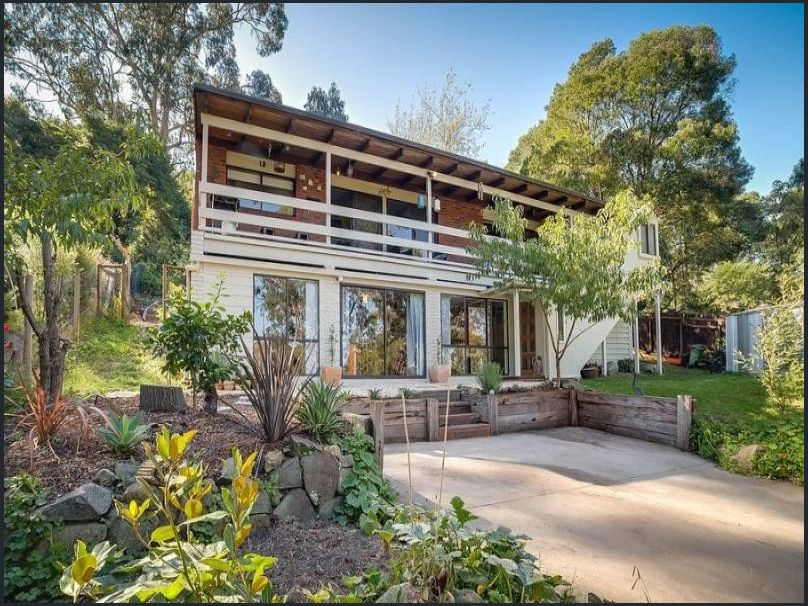 0
0About Belgrave 3160
The size of Belgrave is approximately 4.2 square kilometres. It has 15 parks covering nearly 20.4% of total area. The population of Belgrave in 2011 was 3,966 people. By 2016 the population was 3,935 showing a population decline of 0.8% in the area during that time. The predominant age group in Belgrave is 40-49 years. Households in Belgrave are primarily couples with children and are likely to be repaying $1800 - $2399 per month on mortgage repayments. In general, people in Belgrave work in a professional occupation. In 2011, 86.6% of the homes in Belgrave were owner-occupied compared with 87.8% in 2016.
Belgrave has 1,780 properties. Over the last 5 years, Houses in Belgrave have seen a 27.15% increase in median value, while Units have seen a 24.46% increase. As at 31 December 2024:
- The median value for Houses in Belgrave is $842,176 while the median value for Units is $632,533.
- Houses have a median rent of $660.
Suburb Insights for Belgrave 3160
Market Insights
Belgrave Trends for Houses
N/A
N/A
View TrendN/A
N/A
Belgrave Trends for Units
N/A
N/A
View TrendN/A
N/A
Neighbourhood Insights
© Copyright 2025 RP Data Pty Ltd trading as CoreLogic Asia Pacific (CoreLogic). All rights reserved.
This product uses cookies and other similar technologies to improve and customise your browsing experience, to tailor content and adverts, and for analytics and metrics regarding visitor usage on this product and other media. We may share cookie and analytics information with third parties for the purposes of advertising. By continuing to use our website, you consent to cookies being used. View our Privacy Policy here.
X