47 Cunningham StreetSouth Burnie TAS 7320
Property Details for 47 Cunningham St, South Burnie
47 Cunningham St, South Burnie is a 2 bedroom, 1 bathroom House with 1 parking spaces and was built in 1947. The property has a land size of 640m2 and floor size of 102m2. While the property is not currently for sale or for rent, it was last sold in June 2002.
Last Listing description (August 2013)
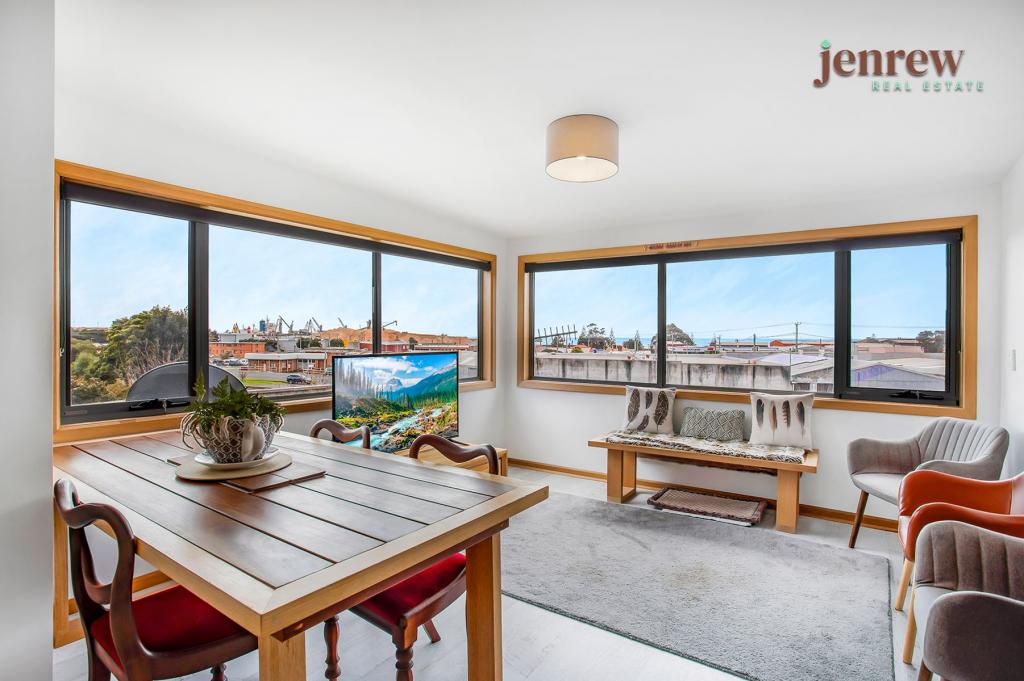
BEAUTIFULLY RENOVATED HOME!
THIS TWO BEDROOM HOME HAS HAD BEAUTIFUL RENOVATIONS COMPLETED THROUGHOUT. BOTH BEDROOMS ARE GENEROUS IN SIZE AND HAVE BUILT-INS, THE KITCHEN HAS BEEN FULLY REFURBISHED AND JUST OUT THE WINDOW YOU HAVE BREATHTAKING VIEWS OF THE BASS STRAIGHT. TO THE FRONT OF THE PROPERTY YOU HAVE YOUR OWN PRIVATE DECKING AREA WHICH WILL BE GREAT FOR THE UPCOMING SUMMER MONTHS TO WHILE THE DAYS AWAY! WITH THE LOCATION, VIEWS AND STUNNING RENOVATIONS THIS HOME WILL NOT LAST LONG!CALL OUR OFFICE TODAY AND TO AVOID ANY DISAPPOINTMENT ARRANGE YOUR INSPECTION WITH OUR PROPERTY MANAGEMENT TEAM.
Property History for 47 Cunningham St, South Burnie, TAS 7320
- 12 Oct 2015Listed for Rent - Price not available
- 29 Aug 2013Listed for Rent $210 / week
- 17 Mar 2010Listed for Sale $155,000
Commute Calculator
Recent sales nearby
See more recent sales nearbySimilar properties For Sale nearby
See more properties for sale nearby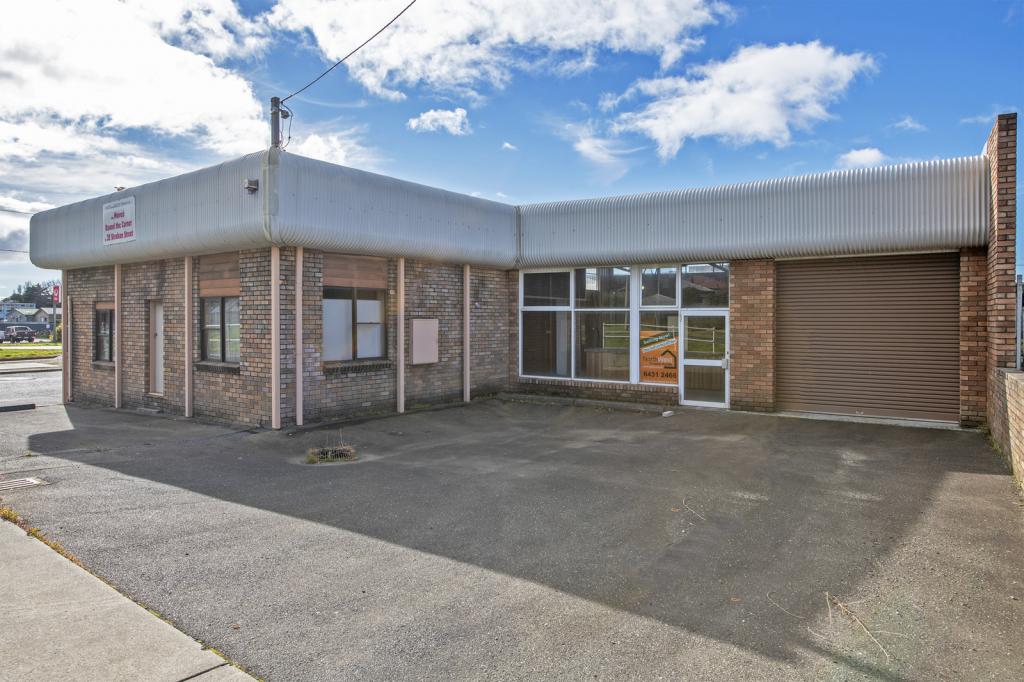 0
0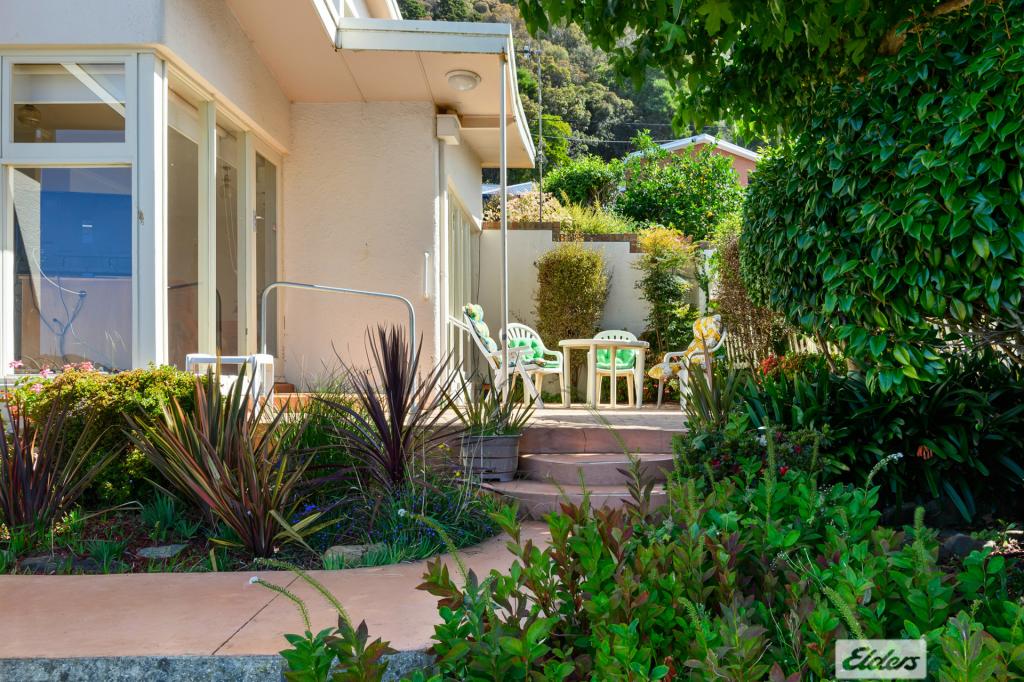 0
0
 0
0Similar properties For Rent nearby
See more properties for rent nearby 0
0 0
0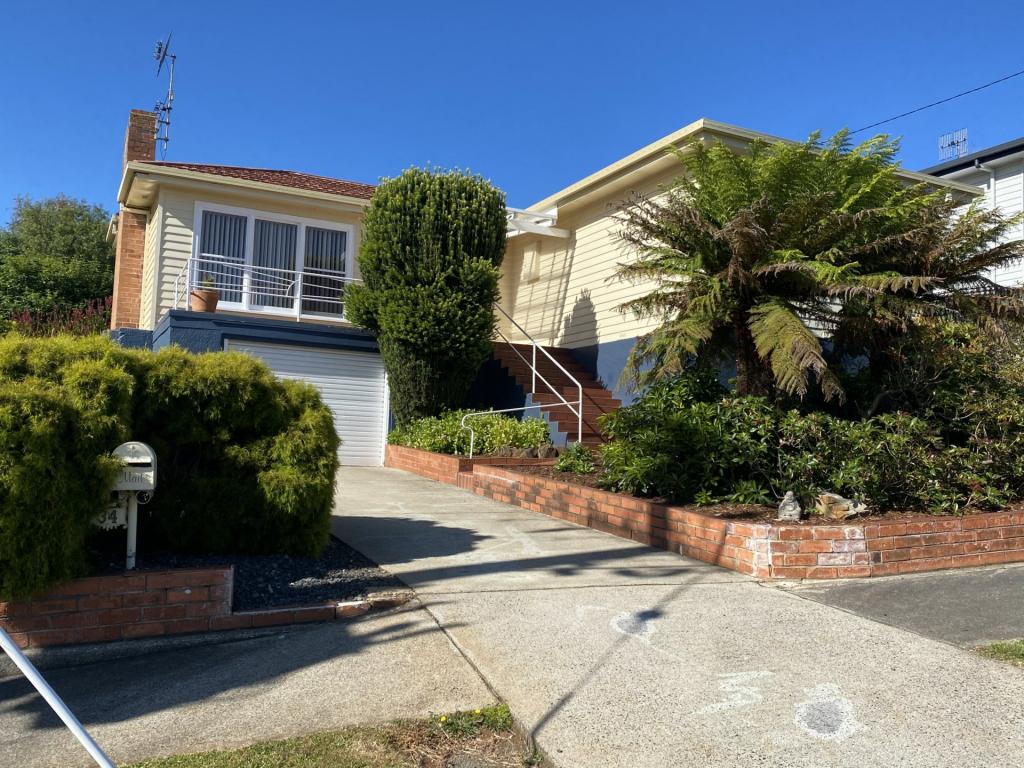 0
0
About South Burnie 7320
The size of South Burnie is approximately 1.7 square kilometres. It has 4 parks covering nearly 4.5% of total area. The population of South Burnie in 2011 was 366 people. By 2016 the population was 317 showing a population decline of 13.4% in the area during that time. The predominant age group in South Burnie is 50-59 years. Households in South Burnie are primarily childless couples and are likely to be repaying $1000 - $1399 per month on mortgage repayments. In general, people in South Burnie work in a professional occupation. In 2011, 70% of the homes in South Burnie were owner-occupied compared with 68.1% in 2016.
South Burnie has 335 properties. Over the last 5 years, Houses in South Burnie have seen a 85.54% increase in median value, while Units have seen a 55.50% increase. As at 30 September 2024:
- The median value for Houses in South Burnie is $404,527 while the median value for Units is $335,166.
- Houses have a median rent of $410.
Suburb Insights for South Burnie 7320
Market Insights
South Burnie Trends for Houses
N/A
N/A
View TrendN/A
N/A
South Burnie Trends for Units
N/A
N/A
View TrendN/A
N/A
Neighbourhood Insights
© Copyright 2024 RP Data Pty Ltd trading as CoreLogic Asia Pacific (CoreLogic). All rights reserved.
This product uses cookies and other similar technologies to improve and customise your browsing experience, to tailor content and adverts, and for analytics and metrics regarding visitor usage on this product and other media. We may share cookie and analytics information with third parties for the purposes of advertising. By continuing to use our website, you consent to cookies being used. View our Privacy Policy here.
X