3 Devon StreetSouth Burnie TAS 7320
Property Details for 3 Devon St, South Burnie
3 Devon St, South Burnie is a 0 bedroom, 0 bathroom House and was built in 1950. The property has a land size of 775m2 and floor size of 145m2. While the property is not currently for sale or for rent, it was last sold in March 2022.
Last Listing description (October 2023)
Approximately 774m2 block containing a large shed with a mezzanine floor in one end and split side access at the other.
This commercially zoned, fully fenced block could be ideal for someone looking to upgrade their small business into it's own space.
*Harcourts Burnie has no reason to doubt the accuracy of the information in this document which has been sourced from means which are considered reliable, however we cannot guarantee accuracy. Prospective purchasers are advised to carry out their own investigations. All measurements are approximate.*
Property History for 3 Devon St, South Burnie, TAS 7320
- 01 Mar 2022Sold for $225,000
- 09 Jul 2021Listed for Sale Best offer over $240,000
- 28 Oct 2011Listed for Sale $240,000
Commute Calculator
Recent sales nearby
See more recent sales nearby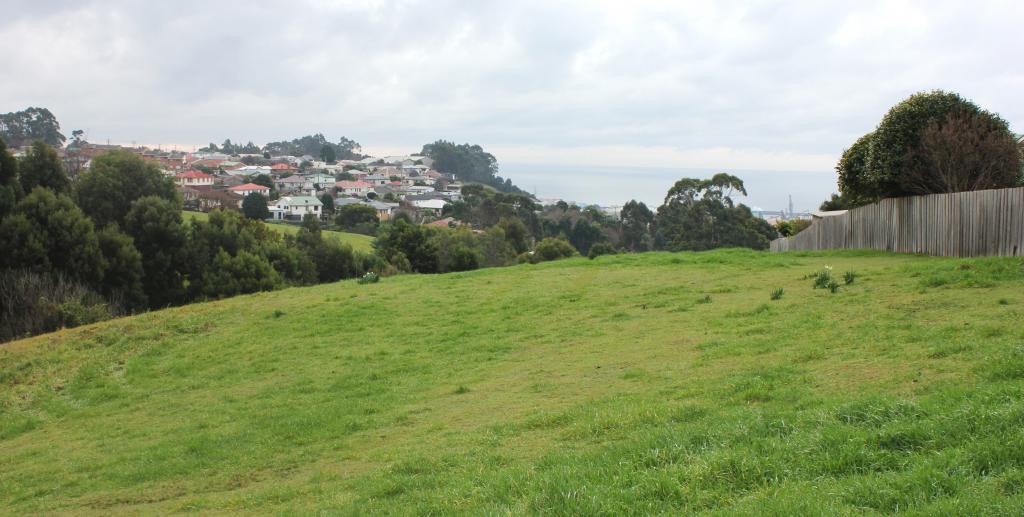 0
0Similar properties For Sale nearby
See more properties for sale nearby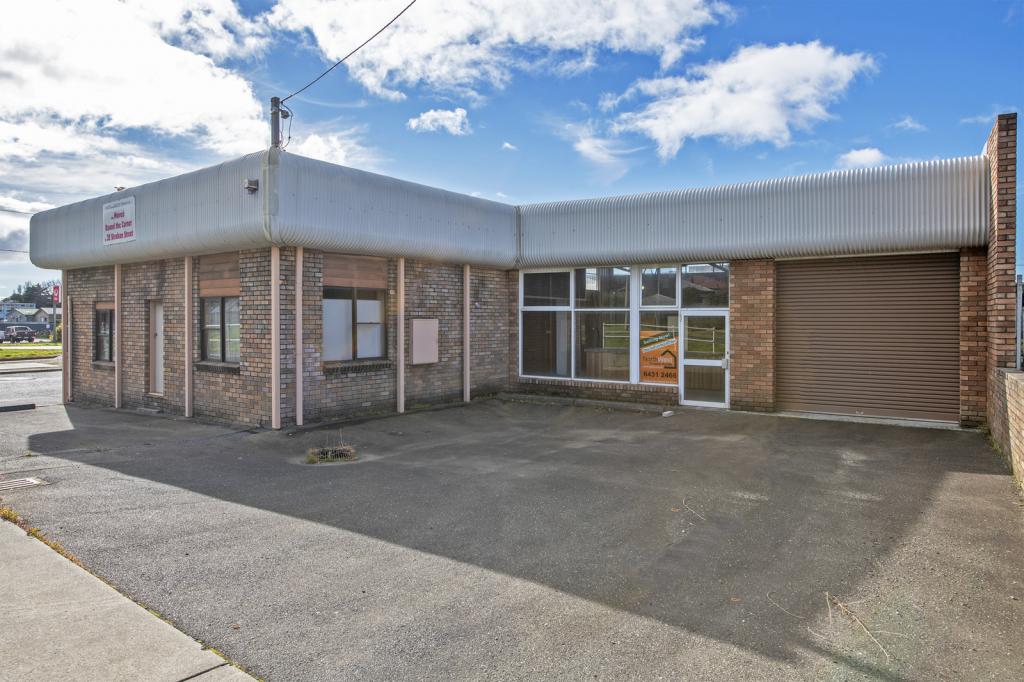 0
0 0
0
 0
0Similar properties For Rent nearby
See more properties for rent nearby 0
0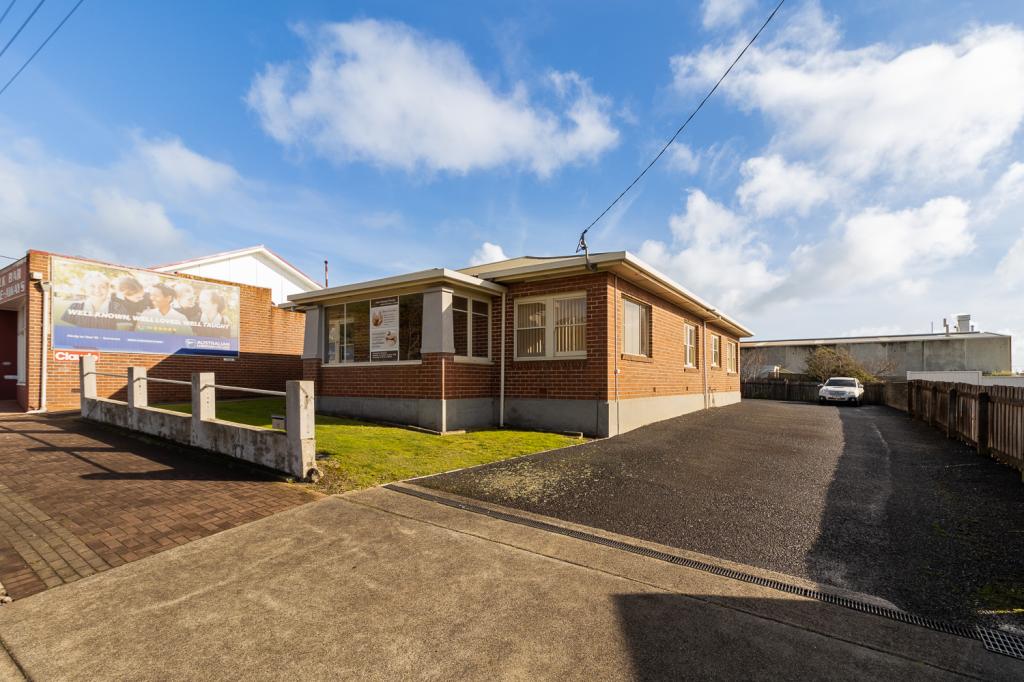 0
0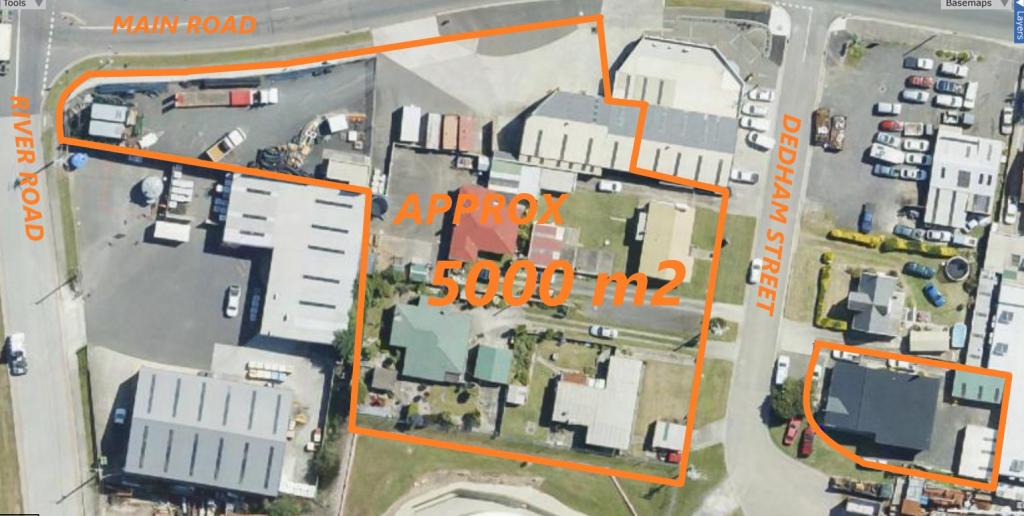 0
0About South Burnie 7320
The size of South Burnie is approximately 1.7 square kilometres. It has 4 parks covering nearly 4.5% of total area. The population of South Burnie in 2011 was 366 people. By 2016 the population was 317 showing a population decline of 13.4% in the area during that time. The predominant age group in South Burnie is 50-59 years. Households in South Burnie are primarily childless couples and are likely to be repaying $1000 - $1399 per month on mortgage repayments. In general, people in South Burnie work in a professional occupation. In 2011, 70% of the homes in South Burnie were owner-occupied compared with 68.1% in 2016.
South Burnie has 335 properties. Over the last 5 years, Houses in South Burnie have seen a 84.86% increase in median value, while Units have seen a 67.55% increase. As at 31 July 2024:
- The median value for Houses in South Burnie is $394,543 while the median value for Units is $337,429.
- Houses have a median rent of $410.
Suburb Insights for South Burnie 7320
Market Insights
South Burnie Trends for Houses
N/A
N/A
View TrendN/A
N/A
South Burnie Trends for Units
N/A
N/A
View TrendN/A
N/A
Neighbourhood Insights
© Copyright 2024 RP Data Pty Ltd trading as CoreLogic Asia Pacific (CoreLogic). All rights reserved.
This product uses cookies and other similar technologies to improve and customise your browsing experience, to tailor content and adverts, and for analytics and metrics regarding visitor usage on this product and other media. We may share cookie and analytics information with third parties for the purposes of advertising. By continuing to use our website, you consent to cookies being used. View our Privacy Policy here.
X