7 Talbot StreetFingal TAS 7214

Thinking about insurance?
Get estimated rebuild costs for this property with Sum SureProperty Details for 7 Talbot St, Fingal
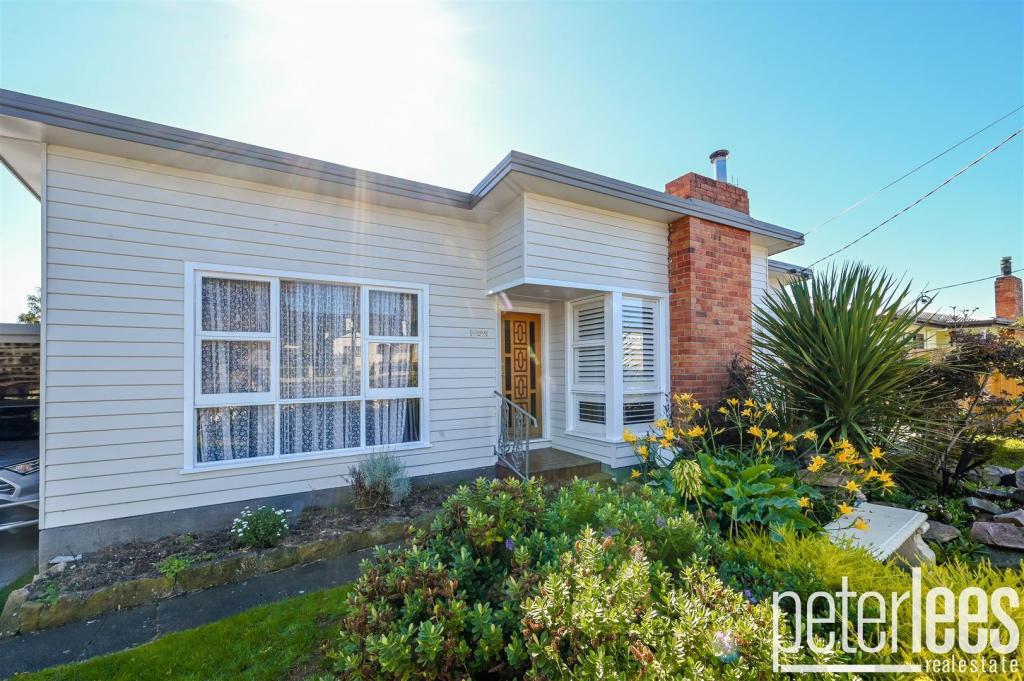
7 Talbot St, Fingal is a 2 bedroom, 1 bathroom House with 3 parking spaces and was built in 1980. The property has a land size of 505m2 and floor size of 98m2. While the property is not currently for sale or for rent, it was last sold in May 2023.
Last Listing description (August 2020)
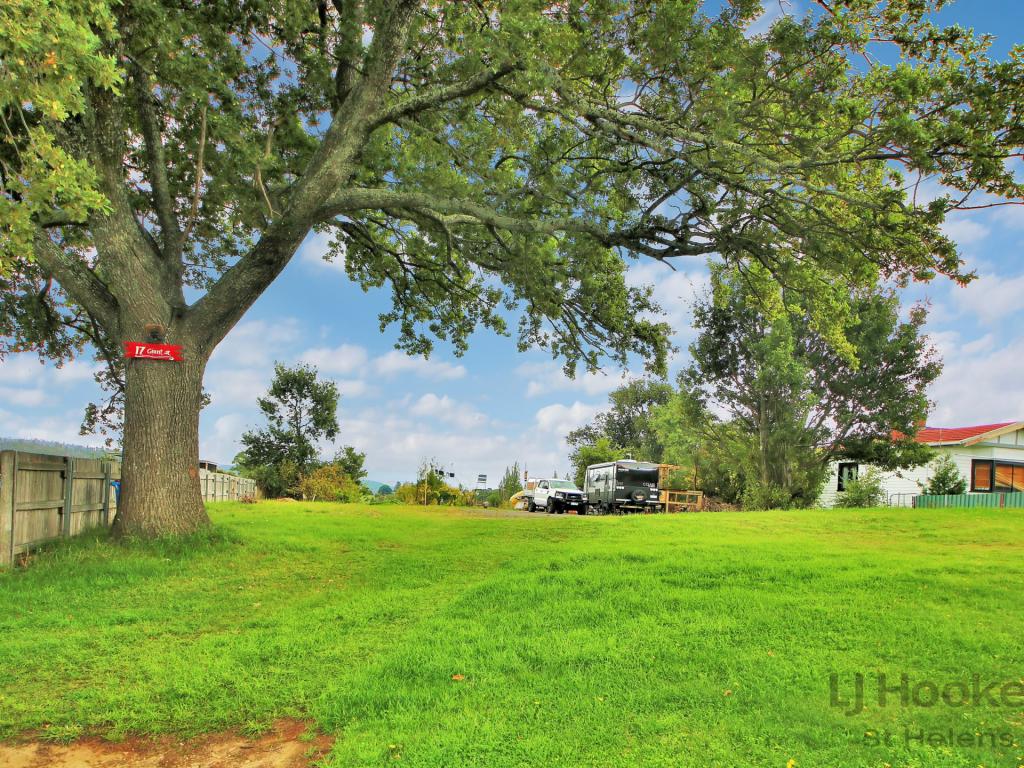
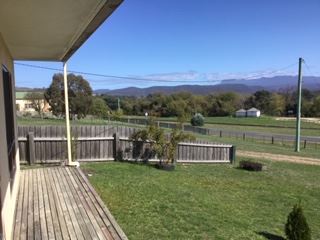
Quaint cottage in the central area of Fingal which is a pleasant country farming town located around 30 minutes drive from Tasmania's magnificent East Coast. The residence has two large bedrooms, central living room with an inbuilt wood heater and reverse cycle heating/cooling unit, kitchen with adjoining dining area, pantry, two toilets, bathroom and a fully enclosed back porch. In the back yard there is a double garage and other small outbuildings. The property is fully fenced. This property offers a country lifestyle close to all that the town offers.
Property History for 7 Talbot St, Fingal, TAS 7214
- 13 May 2023Sold for $245,000
- 13 May 2020Sold for $130,000
- 18 Oct 2019Listed for Sale Best offer over $139,000
Recent sales nearby
See more recent sales nearbySimilar properties For Sale nearby
See more properties for sale nearby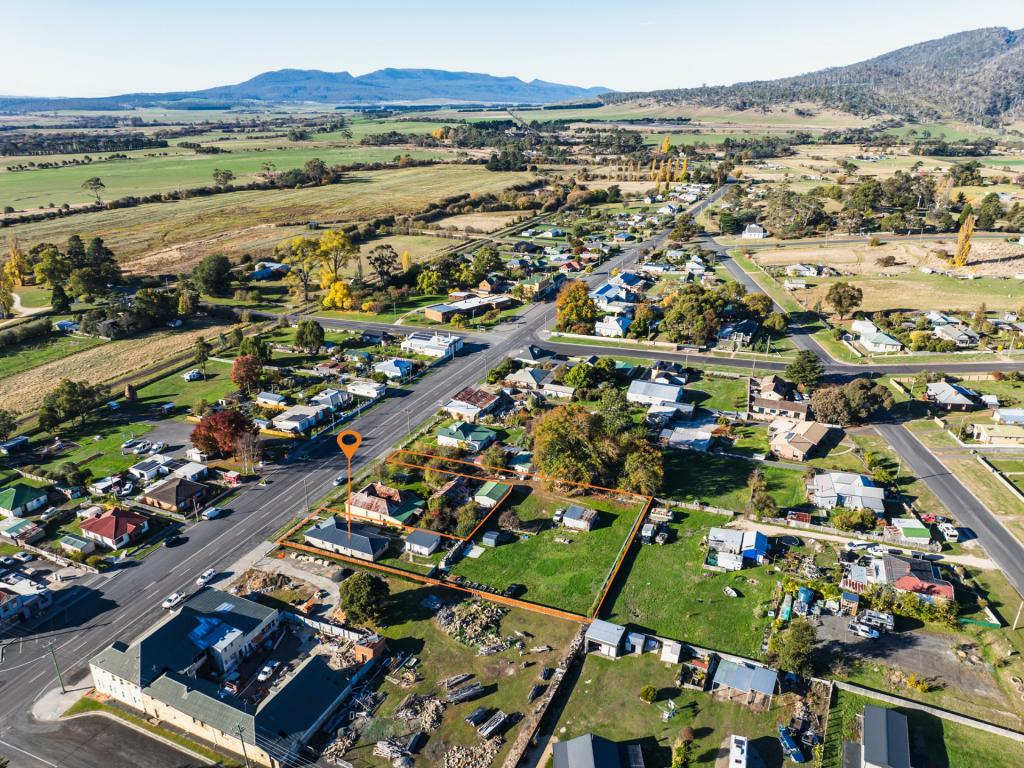
About Fingal 7214
The size of Fingal is approximately 410.8 square kilometres. It has 13 parks covering nearly 44.7% of total area. The population of Fingal in 2011 was 367 people. By 2016 the population was 404 showing a population growth of 10.1% in the area during that time. The predominant age group in Fingal is 60-69 years. Households in Fingal are primarily couples with children and are likely to be repaying $600 - $799 per month on mortgage repayments. In general, people in Fingal work in a machinery operators and drivers occupation. In 2011, 73.4% of the homes in Fingal were owner-occupied compared with 71.1% in 2016.
Fingal has 266 properties. Over the last 5 years, Houses in Fingal have seen a 85.00% increase in median value, while Units have seen a 64.41% increase. As at 28 February 2025:
- The median value for Houses in Fingal is $397,218 while the median value for Units is $392,424.
What's around 7 Talbot St, Fingal


Suburb Insights for Fingal 7214
Market Insights
Fingal Trends for Houses
$397k
19.14%
View TrendN/A
N/A
Fingal Trends for Units
$392k
N/A
View TrendN/A
5.07%
Neighbourhood Insights
Age
Population 404
0-9
12%
10-19
13%
20-29
3%
30-39
9%
40-49
12%
50-59
19%
60-69
21%
70-79
8%
80-89
5%
Household Structure
Occupancy
© Copyright 2025 RP Data Pty Ltd trading as CoreLogic Asia Pacific (CoreLogic). All rights reserved.
(a) give no warranty regarding the data's accuracy, completeness, currency or suitability for any particular purpose; and
(b) do not accept liability howsoever arising, including but not limited to negligence for any loss resulting from the use of or reliance upon the data.
Base data from the LIST © State of Tasmania http://www.thelist.tas.gov.au.
This product uses cookies and other similar technologies to improve and customise your browsing experience, to tailor content and adverts, and for analytics and metrics regarding visitor usage on this product and other media. We may share cookie and analytics information with third parties for the purposes of advertising. By continuing to use our website, you consent to cookies being used. View our Privacy Policy here.
X