52 Seymour StreetBrighton TAS 7030

Property Details for 52 Seymour St, Brighton
52 Seymour St, Brighton is a 4 bedroom, 2 bathroom House with 4 parking spaces. The property has a land size of 712m2 and floor size of 178m2. While the property is not currently for sale or for rent, it was last sold in August 2024. There are 49 other 4 bedroom Houses sold in Brighton in the last 12 months.
Last Listing description (August 2024)
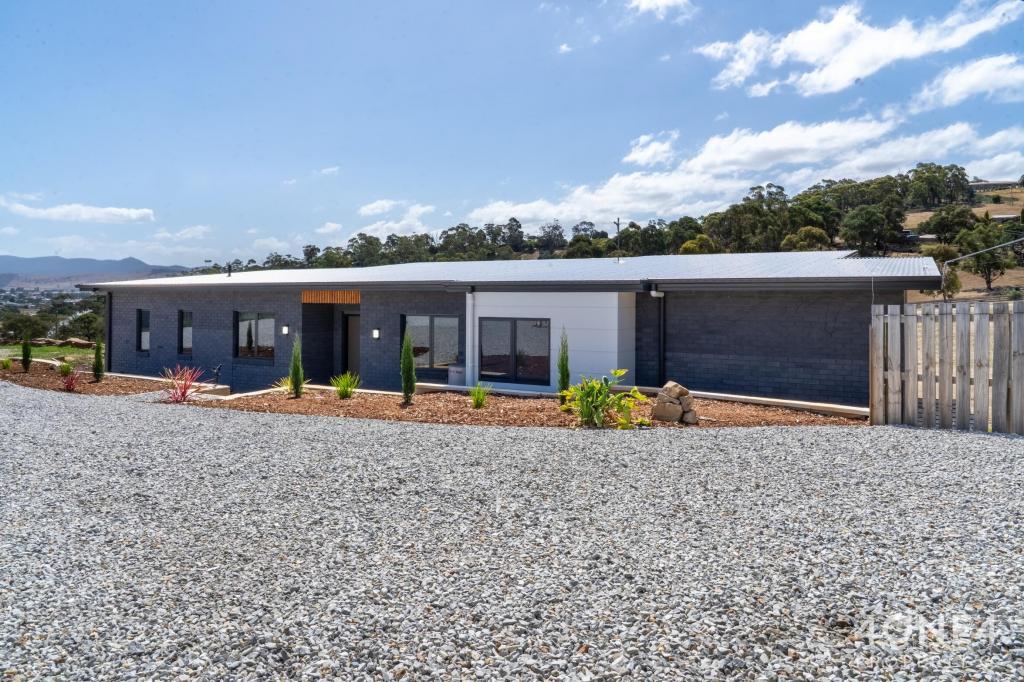
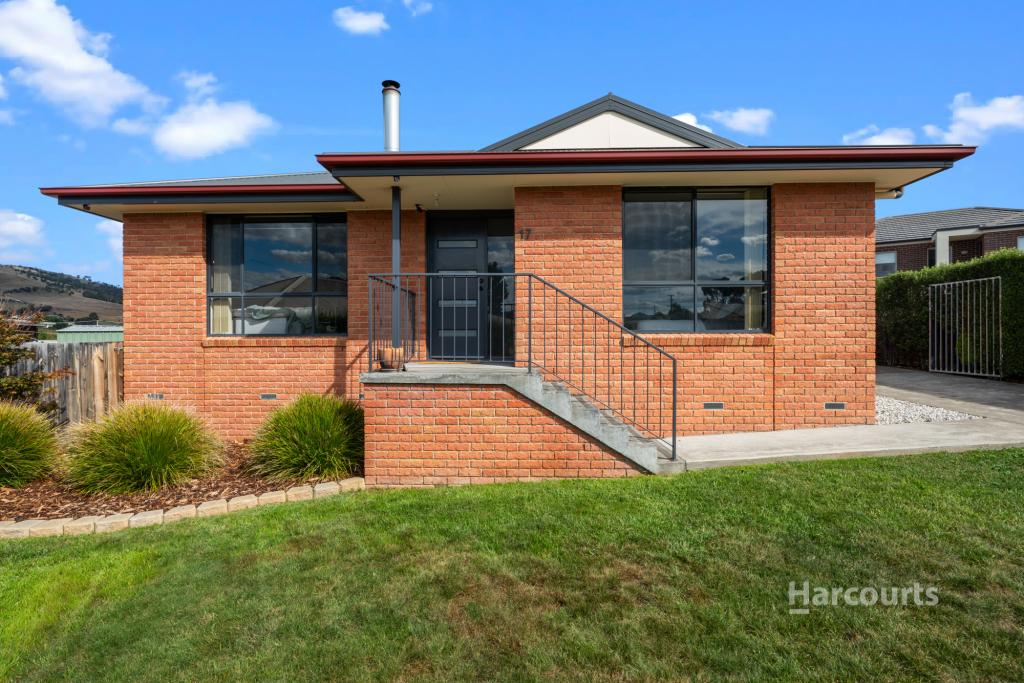
Welcome to 52 Seymour St, Brighton—a stunning family home built in 2013, offering a generous and well-designed floor plan perfect for modern family living. Spanning over 213 square metres of internal floor space, this residence provides ample room for everyone.
Key Features:
Spacious Living: The open-plan living area is set at the back of the home, featuring tiled floors for practicality and easy maintenance. This space seamlessly connects to the alfresco area, making it ideal for indoor-outdoor living and entertaining.
Modern Kitchen: The heart of the home, the large kitchen, boasts a sizeable island bench, a walk-in pantry, and abundant storage space, making it a delight for any home chef.
Private Master Suite: Located at the front of the house, the master bedroom offers privacy and comfort with a spacious ensuite bathroom featuring double sinks and a walk-in robe.
Additional Living Spaces: A second living area serves as a versatile space, perfect for a media room, kids' play area, or a separate study.
Comfortable Bedrooms: Three additional bedrooms, all with built-in robes and carpeted floors, provide cozy retreats for family members.
Family-Friendly Bathrooms: The main bathroom includes a separate shower and bath, catering to all your family's needs.
Secure Parking: A double garage provides secure parking for two cars, with internal access to the home for added convenience.
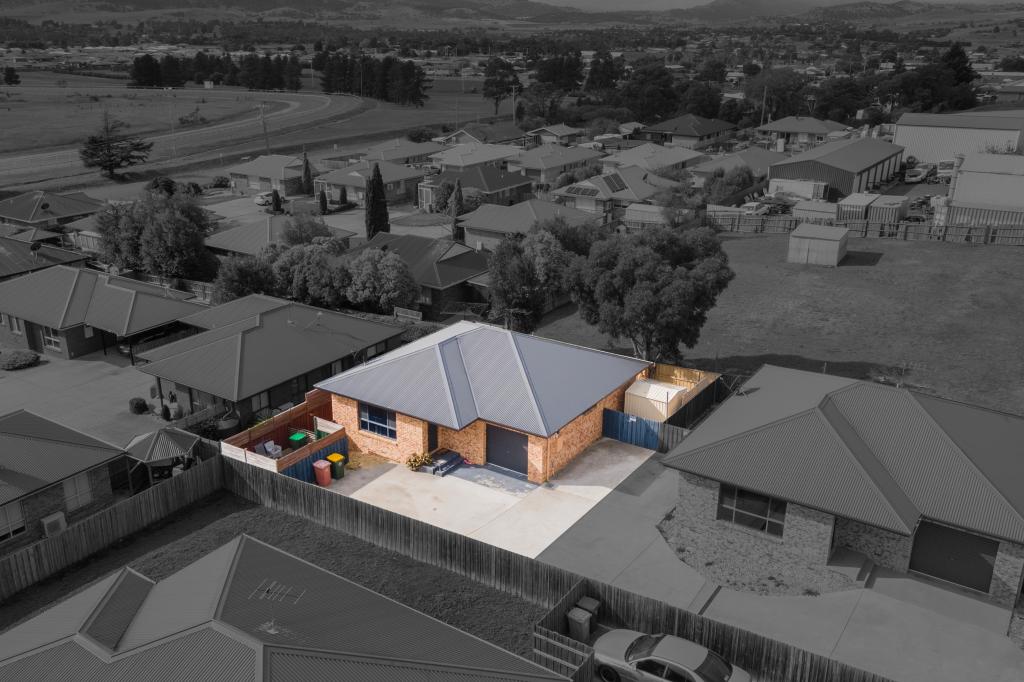
Generous Outdoor Space: Situated on a 712 square metre block, the property features a generous backyard with ample space for children and pets to play securely.
If you're searching for an easy-care, spacious family home, look no further than 52 Seymour St, Brighton. This property is designed to accommodate the needs of a growing family while offering comfort, style, and practicality.
Don't miss the opportunity to make this beautiful home yours. Contact us today to arrange a viewing!
**Virtual stagining used to showcase use of space within the home**
Property History for 52 Seymour St, Brighton, TAS 7030
- 08 Aug 2024Sold for $710,000
- 23 Jul 2024Listed for Sale Offers Over $695,000
- 17 Nov 2010Sold for $125,000
Recent sales nearby
See more recent sales nearby
Similar properties For Sale nearby
See more properties for sale nearby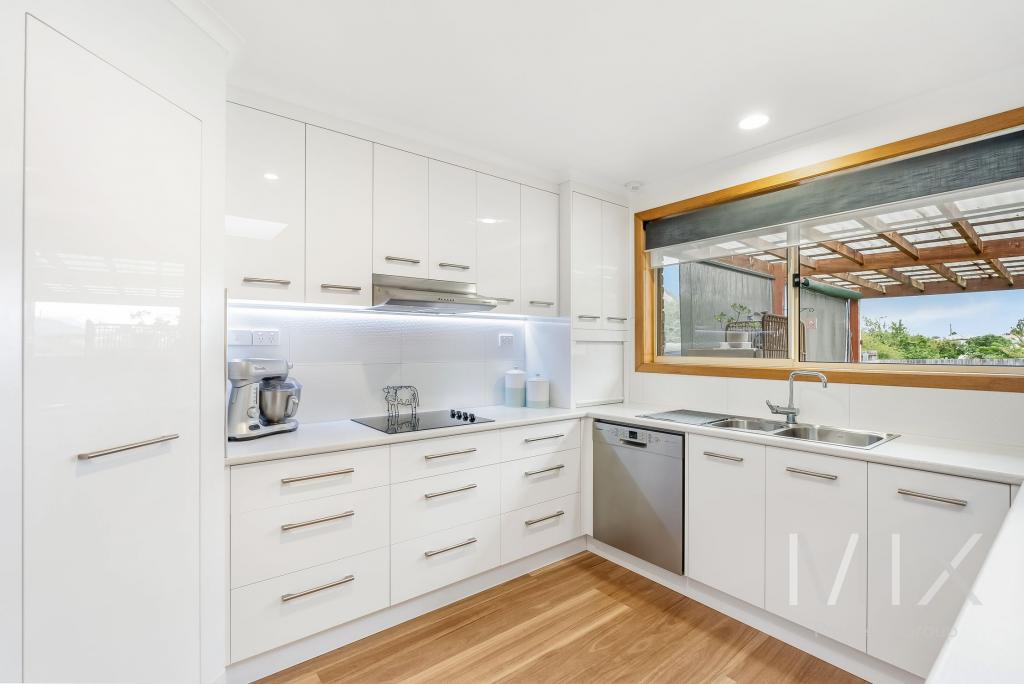


About Brighton 7030
The size of Brighton is approximately 31 square kilometres. It has 3 parks covering nearly 0.3% of total area. The population of Brighton in 2011 was 3,495 people. By 2016 the population was 4,065 showing a population growth of 16.3% in the area during that time. The predominant age group in Brighton is 0-9 years. Households in Brighton are primarily couples with children and are likely to be repaying $1000 - $1399 per month on mortgage repayments. In general, people in Brighton work in a trades occupation. In 2011, 77.9% of the homes in Brighton were owner-occupied compared with 74.2% in 2016.
Brighton has 2,559 properties. Over the last 5 years, Houses in Brighton have seen a 51.39% increase in median value, while Units have seen a 47.40% increase. As at 31 March 2025:
- The median value for Houses in Brighton is $588,554 while the median value for Units is $434,702.
- Houses have a median rent of $505 while Units have a median rent of $450.
What's around 52 Seymour St, Brighton
52 Seymour St, Brighton is in the school catchment zone for Brighton Primary School.


Suburb Insights for Brighton 7030
Market Insights
Brighton Trends for Houses
$589k
-0.07%
View Trend$505/W
4.80%
Brighton Trends for Units
$435k
-3.77%
View Trend$450/W
5.52%
Neighbourhood Insights
Age
Population 4,065
0-9
16%
10-19
13%
20-29
16%
30-39
14%
40-49
14%
50-59
11%
60-69
9%
70-79
6%
80-89
2%
Household Structure
Occupancy
© Copyright 2025 RP Data Pty Ltd trading as CoreLogic Asia Pacific (CoreLogic). All rights reserved.
(a) give no warranty regarding the data's accuracy, completeness, currency or suitability for any particular purpose; and
(b) do not accept liability howsoever arising, including but not limited to negligence for any loss resulting from the use of or reliance upon the data.
Base data from the LIST © State of Tasmania http://www.thelist.tas.gov.au.
This product uses cookies and other similar technologies to improve and customise your browsing experience, to tailor content and adverts, and for analytics and metrics regarding visitor usage on this product and other media. We may share cookie and analytics information with third parties for the purposes of advertising. By continuing to use our website, you consent to cookies being used. View our Privacy Policy here.
X