48 Billing StreetWhyalla Playford SA 5600
Property Details for 48 Billing St, Whyalla Playford
48 Billing St, Whyalla Playford is a 3 bedroom, 1 bathroom House with 1 parking spaces and was built in 1971. The property has a land size of 771m2 and floor size of 105m2. While the property is not currently for sale or for rent, it was last sold in July 2022.
Last Listing description (November 2022)
** APPLICATIONS TO BE COMPLETED PRIOR TO VIEWING **
** APPLICATIONS CLOSED **
* 3 bedrooms, all with ceiling fans * Bedrooms 1 & 2 with built in wardrobe * Upgraded kitchen with electric cooking * Open plan living area with reverse cycle split system & ceiling fan * Polished floorboards throughout * Freshly painted * New blinds throughout * Upgraded bathroom with separate bath & shower * Good sized back yard with large shed & covered entertaining area
RLA110
Property History for 48 Billing St, Whyalla Playford, SA 5600
- 17 Oct 2022Listed for Rent $350 / week
- 13 Jul 2022Sold for $206,000
- 19 Jan 2022Listed for Sale $225,0000 - $230,000
Commute Calculator
Recent sales nearby
See more recent sales nearby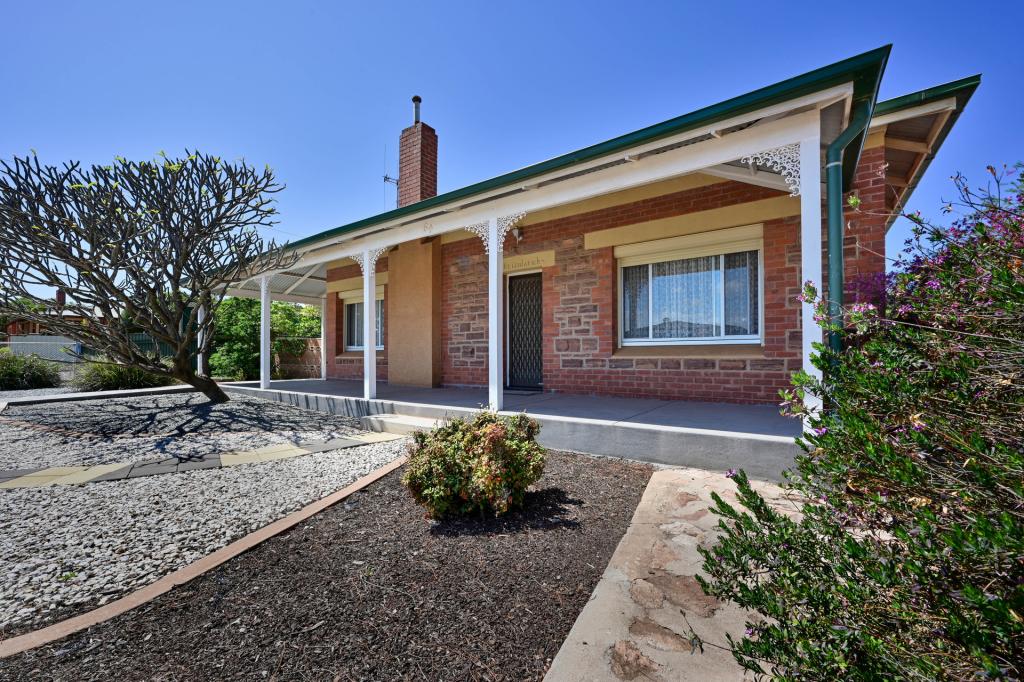 0
0 0
0
 0
0Similar properties For Sale nearby
See more properties for sale nearby 0
0 0
0 0
0Similar properties For Rent nearby
See more properties for rent nearby 0
0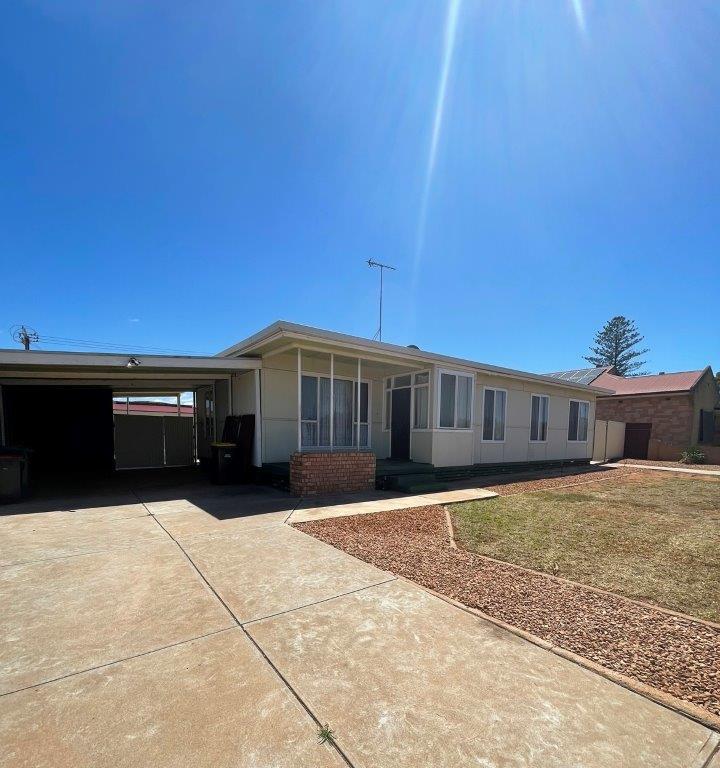 0
0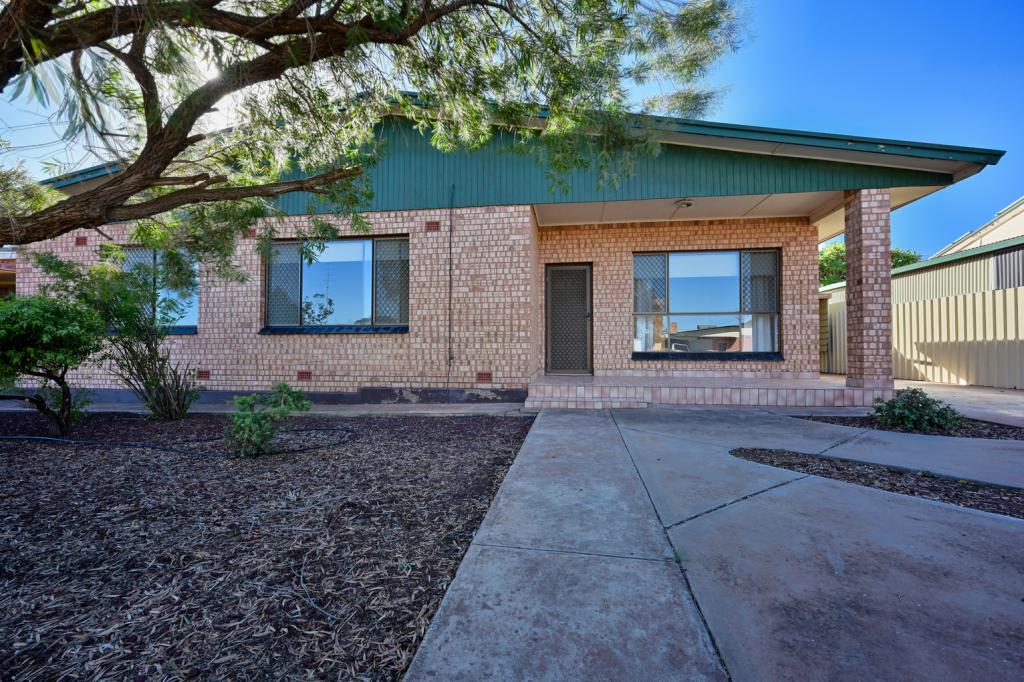 0
0About Whyalla Playford 5600
The size of Whyalla Playford is approximately 3.3 square kilometres. It has 17 parks covering nearly 25.1% of total area. The population of Whyalla Playford in 2011 was 2,763 people. By 2016 the population was 2,544 showing a population decline of 7.9% in the area during that time. The predominant age group in Whyalla Playford is 50-59 years. Households in Whyalla Playford are primarily childless couples and are likely to be repaying $1000 - $1399 per month on mortgage repayments. In general, people in Whyalla Playford work in a trades occupation. In 2011, 75.6% of the homes in Whyalla Playford were owner-occupied compared with 74.4% in 2016.
Whyalla Playford has 1,457 properties. Over the last 5 years, Houses in Whyalla Playford have seen a 66.07% increase in median value, while Units have seen a 36.39% increase. As at 31 October 2024:
- The median value for Houses in Whyalla Playford is $283,878 while the median value for Units is $192,359.
- Houses have a median rent of $360 while Units have a median rent of $280.
Suburb Insights for Whyalla Playford 5600
Market Insights
Whyalla Playford Trends for Houses
N/A
N/A
View TrendN/A
N/A
Whyalla Playford Trends for Units
N/A
N/A
View TrendN/A
N/A
Neighbourhood Insights
© Copyright 2024 RP Data Pty Ltd trading as CoreLogic Asia Pacific (CoreLogic). All rights reserved.
This product uses cookies and other similar technologies to improve and customise your browsing experience, to tailor content and adverts, and for analytics and metrics regarding visitor usage on this product and other media. We may share cookie and analytics information with third parties for the purposes of advertising. By continuing to use our website, you consent to cookies being used. View our Privacy Policy here.
X