10/23 Noble StreetOvingham SA 5082
Property Details for 10/23 Noble St, Ovingham
10/23 Noble St, Ovingham is a 2 bedroom, 1 bathroom Unit with 1 parking spaces and was built in 1970. The property has a land size of 75m2 and floor size of 60m2. While the property is not currently for sale or for rent, it was last sold in April 2023.
Last Listing description (February 2010)
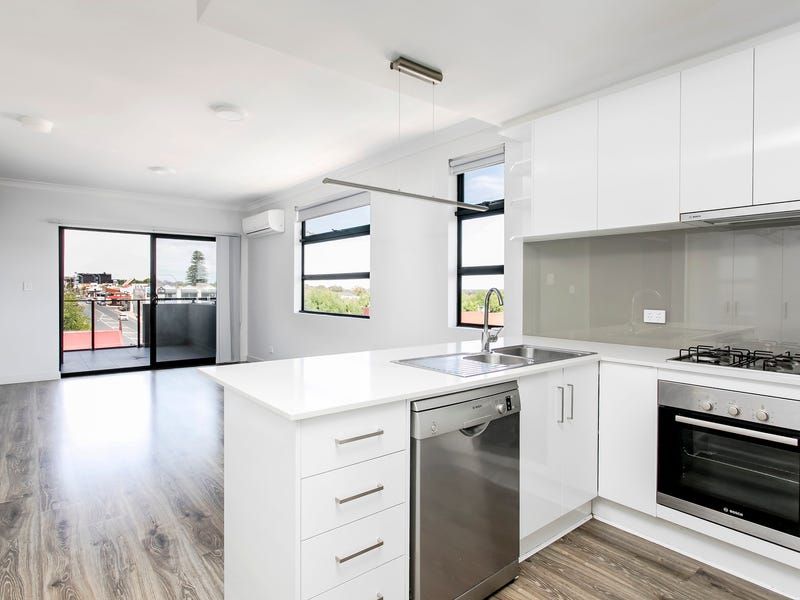
SUPERBLY RENOVATED ??? MODERN DECOR
IDEAL TO OCCUPY OR INVEST
IMMACULATELY PRESENTED 2 BEDROOM UPSTAIRS STRATA TITLE HOME UNIT. OPEN LIVING LOUNGE, DINE AND KITCHEN WITH MODERN APPLIANCES. GOOD SIZE MAIN AND 2ND BEDROOM. FLOOR TILING THROUGHOUT THE LIVING AREAS, NEW CARPETING, REPAINTED. BALCONY AND CARPORT. PUBLIC TRANSPORT CLOSE BY. LEASED UNTIL 31ST MARCH 2010 AT $300 PER WEEK FULLY FURNISHED. (FURNITURE PURCHASE BY NEGOTIATION) AN AREA AND PROPERTY IN DEMAND. DON???T DELAY!
Property History for 10/23 Noble St, Ovingham, SA 5082
- 11 Apr 2023Sold for $297,511
- 30 Oct 2012Listed for Rent $285 / week
- 07 Dec 2010Listed for Rent - Price not available
Commute Calculator
Recent sales nearby
See more recent sales nearbySimilar properties For Sale nearby
See more properties for sale nearby 0
0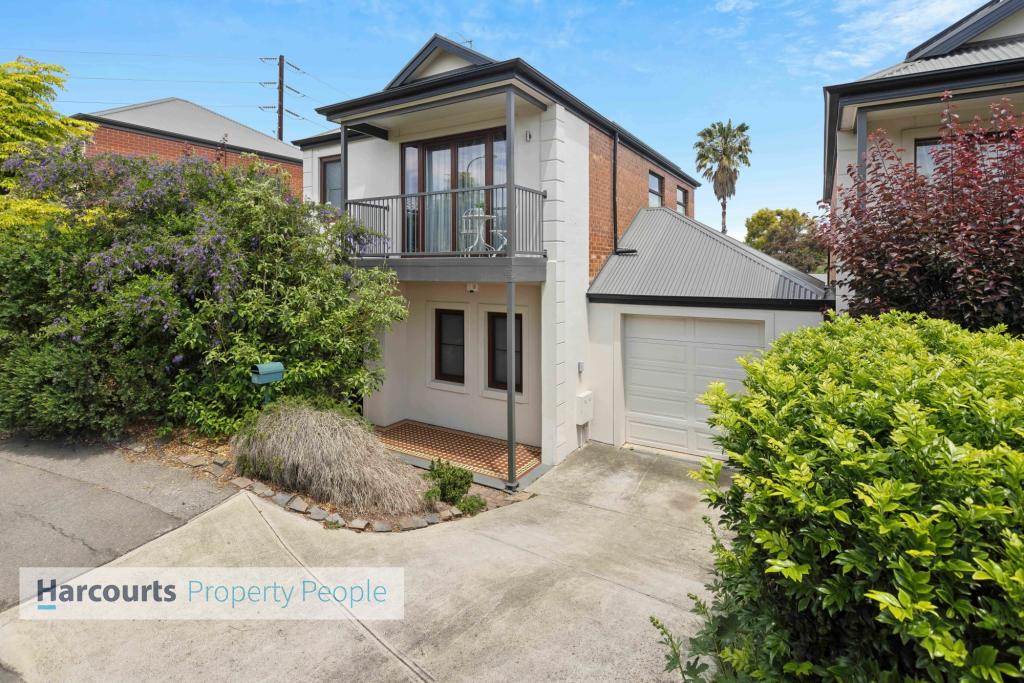 0
0
 0
0Similar properties For Rent nearby
See more properties for rent nearby 0
0
 0
0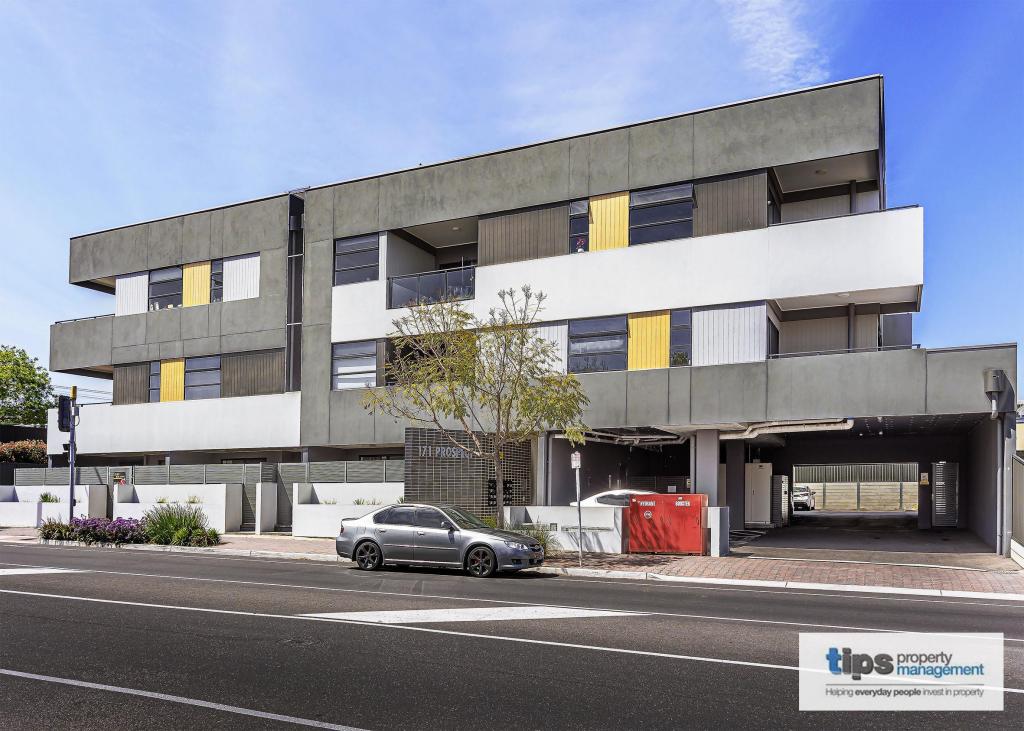 0
0Suburb Insights for Ovingham 5082
Market Insights
Ovingham Trends for Houses
N/A
N/A
View TrendN/A
N/A
Ovingham Trends for Units
N/A
N/A
View TrendN/A
N/A
Neighbourhood Insights
© Copyright 2024 RP Data Pty Ltd trading as CoreLogic Asia Pacific (CoreLogic). All rights reserved.
This product uses cookies and other similar technologies to improve and customise your browsing experience, to tailor content and adverts, and for analytics and metrics regarding visitor usage on this product and other media. We may share cookie and analytics information with third parties for the purposes of advertising. By continuing to use our website, you consent to cookies being used. View our Privacy Policy here.
X