9 Surrey CrescentLower Mitcham SA 5062
Property Details for 9 Surrey Cres, Lower Mitcham
9 Surrey Cres, Lower Mitcham is a 2 bedroom, 1 bathroom House and was built in 1950. The property has a land size of 1630m2 and floor size of 90m2. While the property is not currently for sale or for rent, it was last sold in August 2016.
Last Listing description (September 2016)
**UNDER CONTRACT**
We are proud to offer to the market this exclusive 1,656m parcel of land located in a leafy quite street in Lower Mitcham.
This north facing allotment presents a rare opportunity to create a grand family residence or an exclusive development. Currently it has an approval for sub-division into two Torrens Title allotments or potential to sub-divide into three (S.T.C.A).
Don't miss an opportunity to buy rare land in this prestige tightly held suburb, call us today!
Property History for 9 Surrey Cres, Lower Mitcham, SA 5062
- 30 Aug 2016Sold for $1,180,000
- 25 Feb 2016Listed for Sale $1,150,000 - $1,250,000
- 19 Jan 1996Sold for $175,000
Commute Calculator
Recent sales nearby
See more recent sales nearbySimilar properties For Sale nearby
See more properties for sale nearby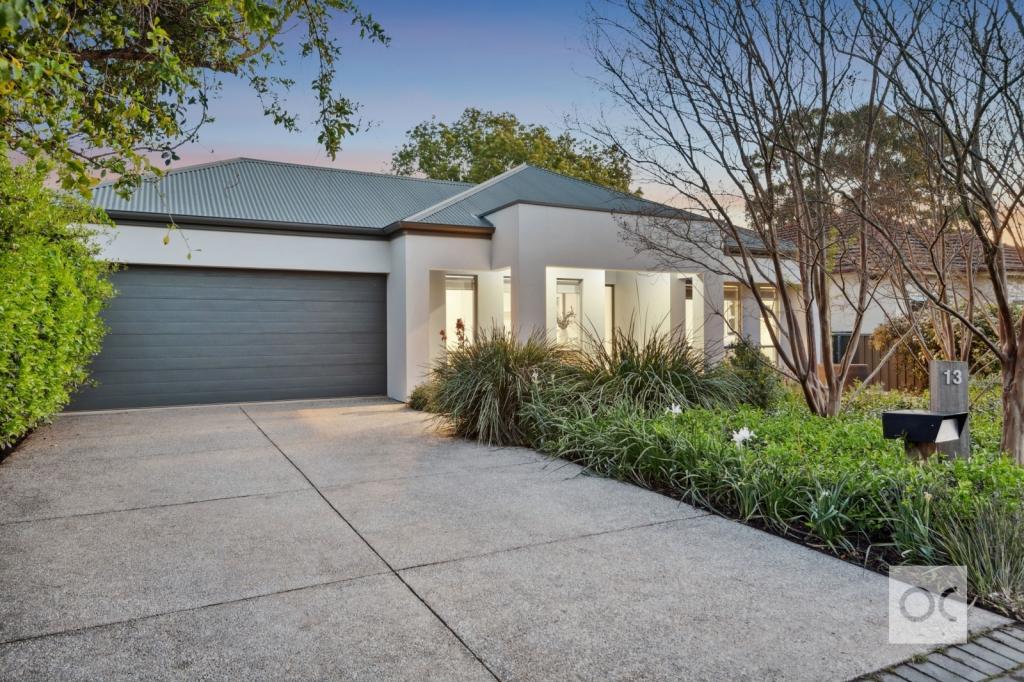 0
0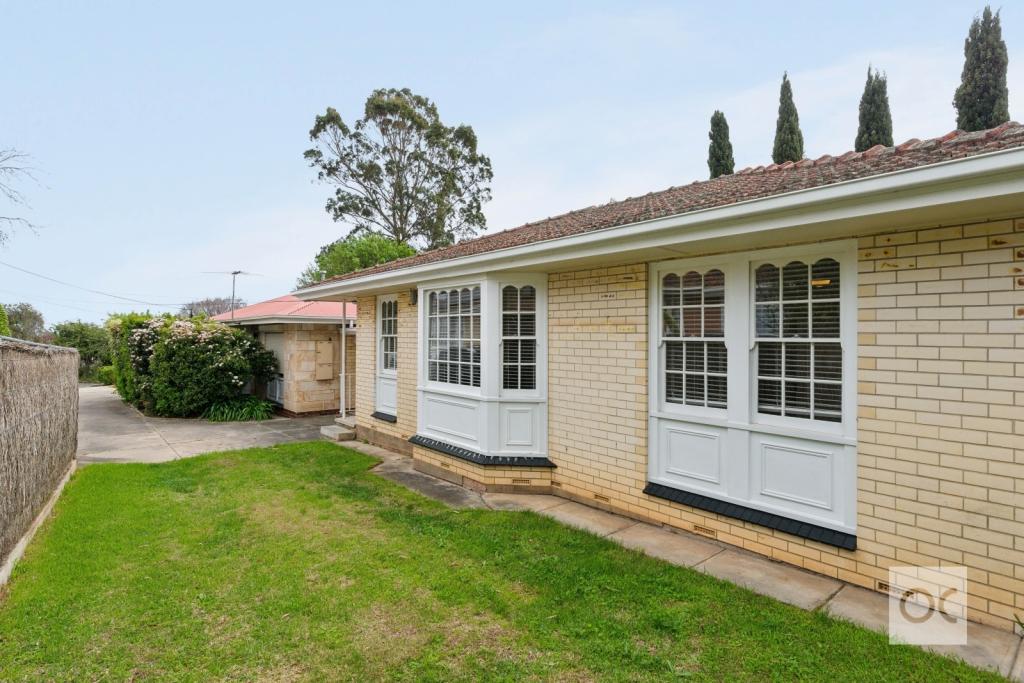 0
0 0
0Similar properties For Rent nearby
See more properties for rent nearby 0
0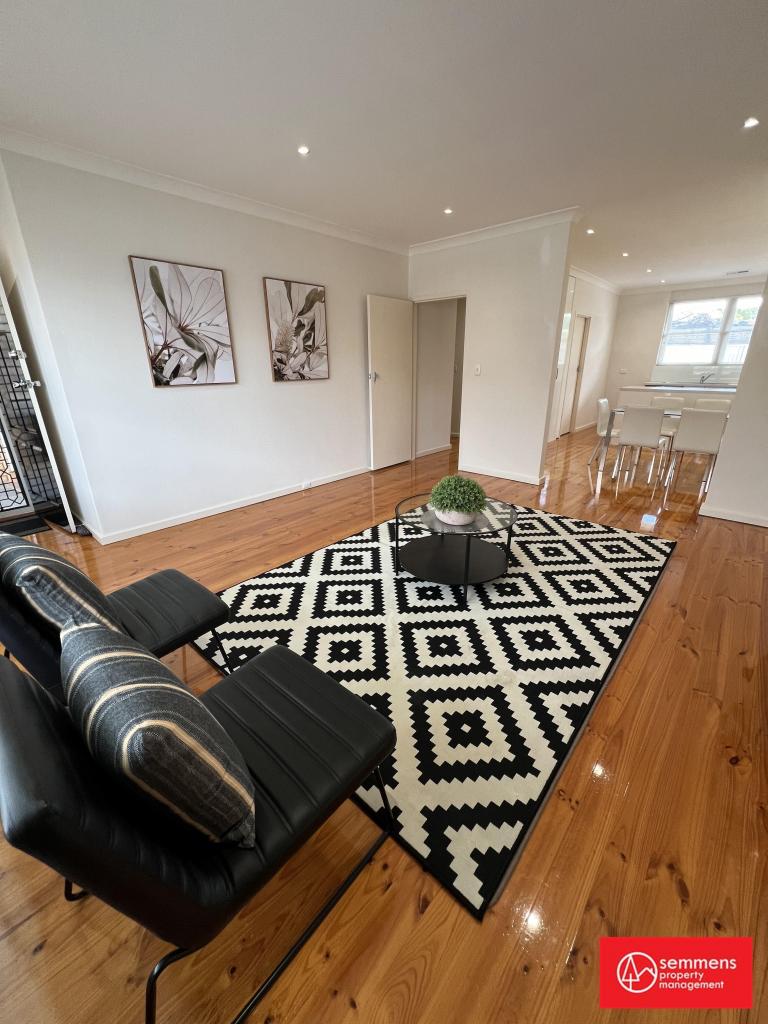 0
0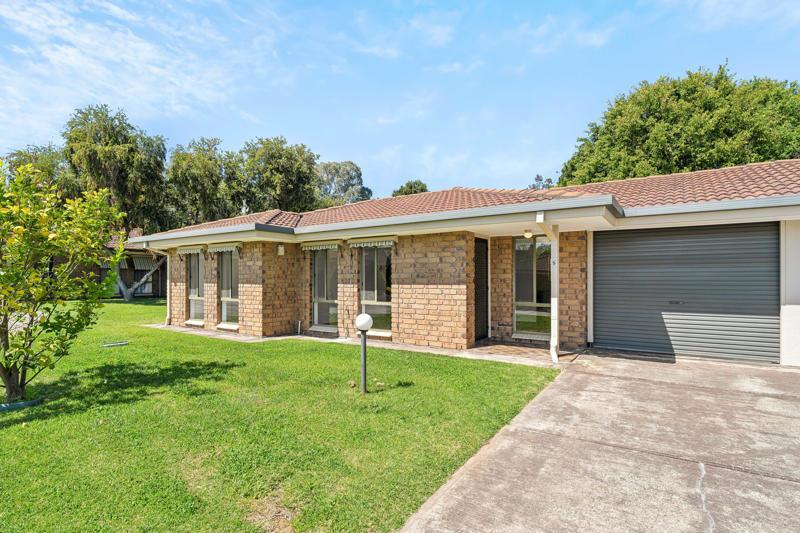 0
0About Lower Mitcham 5062
The size of Lower Mitcham is approximately 0.9 square kilometres. It has 3 parks covering nearly 1.3% of total area. The population of Lower Mitcham in 2011 was 2,063 people. By 2016 the population was 2,140 showing a population growth of 3.7% in the area during that time. The predominant age group in Lower Mitcham is 50-59 years. Households in Lower Mitcham are primarily couples with children and are likely to be repaying $1800 - $2399 per month on mortgage repayments. In general, people in Lower Mitcham work in a professional occupation. In 2011, 79.1% of the homes in Lower Mitcham were owner-occupied compared with 79.6% in 2016.
Lower Mitcham has 967 properties. Over the last 5 years, Houses in Lower Mitcham have seen a 64.32% increase in median value, while Units have seen a 69.28% increase. As at 30 September 2024:
- The median value for Houses in Lower Mitcham is $1,364,749 while the median value for Units is $533,181.
- Houses have a median rent of $720 while Units have a median rent of $350.
Suburb Insights for Lower Mitcham 5062
Market Insights
Lower Mitcham Trends for Houses
N/A
N/A
View TrendN/A
N/A
Lower Mitcham Trends for Units
N/A
N/A
View TrendN/A
N/A
Neighbourhood Insights
© Copyright 2024 RP Data Pty Ltd trading as CoreLogic Asia Pacific (CoreLogic). All rights reserved.
This product uses cookies and other similar technologies to improve and customise your browsing experience, to tailor content and adverts, and for analytics and metrics regarding visitor usage on this product and other media. We may share cookie and analytics information with third parties for the purposes of advertising. By continuing to use our website, you consent to cookies being used. View our Privacy Policy here.
X