22 Lovelock StreetHighbury SA 5089
Property Details for 22 Lovelock St, Highbury
22 Lovelock St, Highbury is a 3 bedroom, 1 bathroom House with 2 parking spaces and was built in 1972. The property has a land size of 694m2 and floor size of 145m2. While the property is not currently for sale or for rent, it was last sold in August 2019.
Last Listing description (September 2019)
* Solid Brick home situated in a very quiet & secluded location.
* Home comprises , modern kitchen with stainless steel appliances, dishwasher & walk-in pantry..
* Three good sized bedrooms with built-in robe to main bedroom.
* Large family room with slate floors.
* Separate bathroom and toilet.
* Ducted cooling plus ducted gas heating.
* Outside we have a paved verandah area and spacious rear garden.
* Carport with auto roller door plus double garage at rear
* Currently tenanted until 6th September 2019
* Close to Shops, Transport and Highbury Hotel.
Property History for 22 Lovelock St, Highbury, SA 5089
- 14 Aug 2019Sold for $405,000
- 01 May 2019Listed for Sale $399,000 - $429,000
- 18 Jul 2017Listed for Rent - Price not available
Commute Calculator
Recent sales nearby
See more recent sales nearby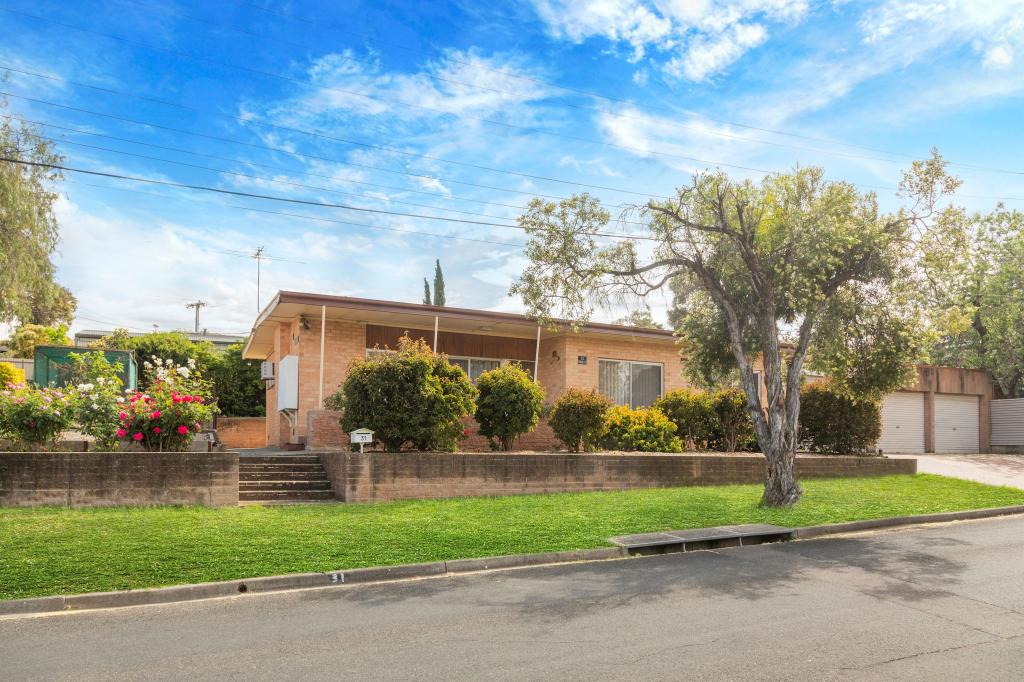 0
0 0
0Similar properties For Sale nearby
See more properties for sale nearby
 0
0 0
0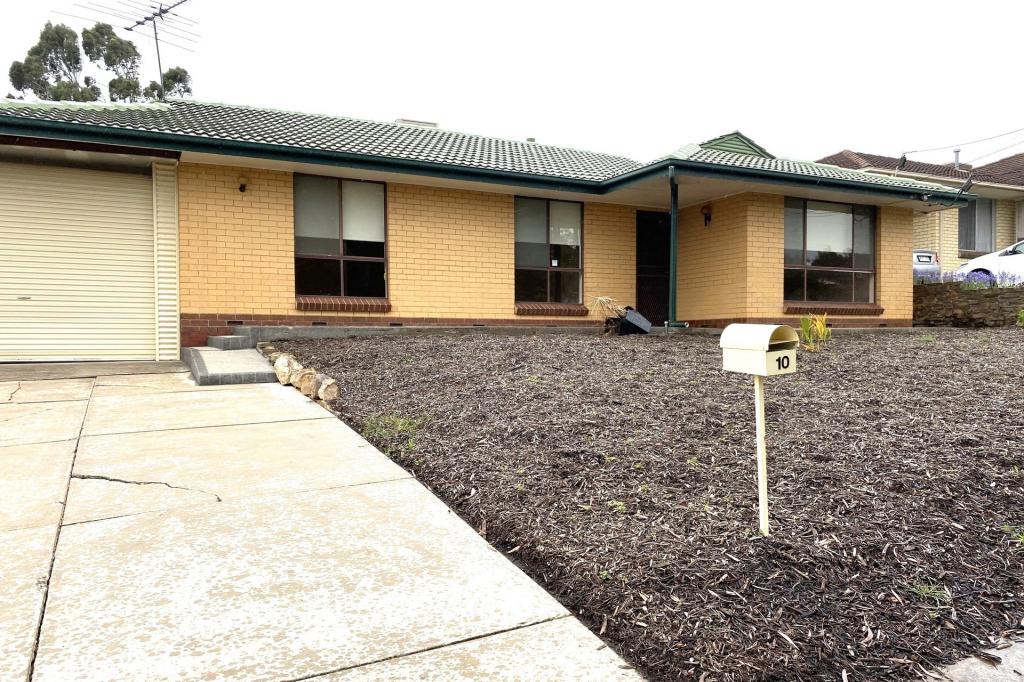 0
0Similar properties For Rent nearby
See more properties for rent nearby 0
0 0
0 0
0About Highbury 5089
The size of Highbury is approximately 8.1 square kilometres. It has 24 parks covering nearly 16.2% of total area. The population of Highbury in 2011 was 6,647 people. By 2016 the population was 6,574 showing a population decline of 1.1% in the area during that time. The predominant age group in Highbury is 40-49 years. Households in Highbury are primarily couples with children and are likely to be repaying $1800 - $2399 per month on mortgage repayments. In general, people in Highbury work in a professional occupation. In 2011, 87.4% of the homes in Highbury were owner-occupied compared with 86.1% in 2016.
Highbury has 2,933 properties. Over the last 5 years, Houses in Highbury have seen a 71.54% increase in median value, while Units have seen a 89.83% increase. As at 31 October 2024:
- The median value for Houses in Highbury is $932,239 while the median value for Units is $622,835.
- Houses have a median rent of $600.
Suburb Insights for Highbury 5089
Market Insights
Highbury Trends for Houses
N/A
N/A
View TrendN/A
N/A
Highbury Trends for Units
N/A
N/A
View TrendN/A
N/A
Neighbourhood Insights
© Copyright 2024 RP Data Pty Ltd trading as CoreLogic Asia Pacific (CoreLogic). All rights reserved.
This product uses cookies and other similar technologies to improve and customise your browsing experience, to tailor content and adverts, and for analytics and metrics regarding visitor usage on this product and other media. We may share cookie and analytics information with third parties for the purposes of advertising. By continuing to use our website, you consent to cookies being used. View our Privacy Policy here.
X