7/144 Seaview RoadHenley Beach South SA 5022
Property Details for 7/144 Seaview Rd, Henley Beach South
7/144 Seaview Rd, Henley Beach South is a 2 bedroom, 1 bathroom Unit with 1 parking spaces and was built in 1972. The property has a land size of 71m2 and floor size of 61m2. While the property is not currently for sale or for rent, it was last sold in October 2021.
Last Listing description (January 2024)
Looking to rent along the beach, then this is the property for you!
Features include:
- 2 good sized bedrooms, both featuring built in robes
- Laundry facilities in bathroom
- Conveniently located at the rear of the group with gated secure parking via Military Rd
Located only a very short walk to the beach, as well as Henley Square and all it has to offer.
Sorry no pets.
Property History for 7/144 Seaview Rd, Henley Beach South, SA 5022
- 12 Jan 2024Listed for Rent $400 / week
- 01 Oct 2021Sold for $285,000
- 19 Feb 2014Listed for Rent - Price not available
Commute Calculator
Recent sales nearby
See more recent sales nearbySimilar properties For Sale nearby
See more properties for sale nearby 0
0
 0
0 0
0Similar properties For Rent nearby
See more properties for rent nearby 0
0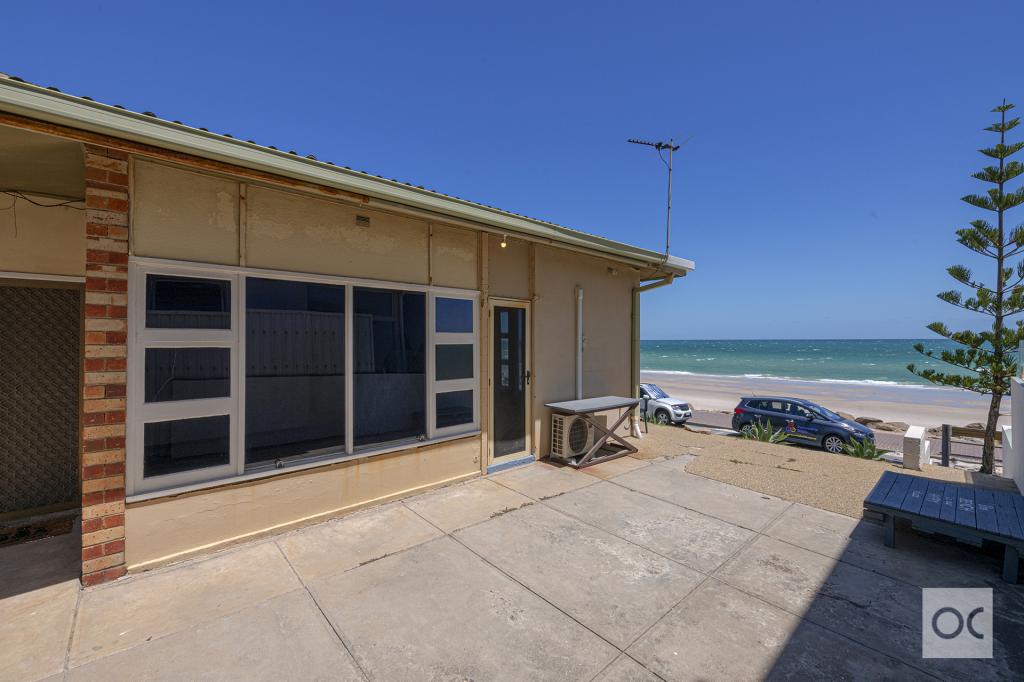 0
0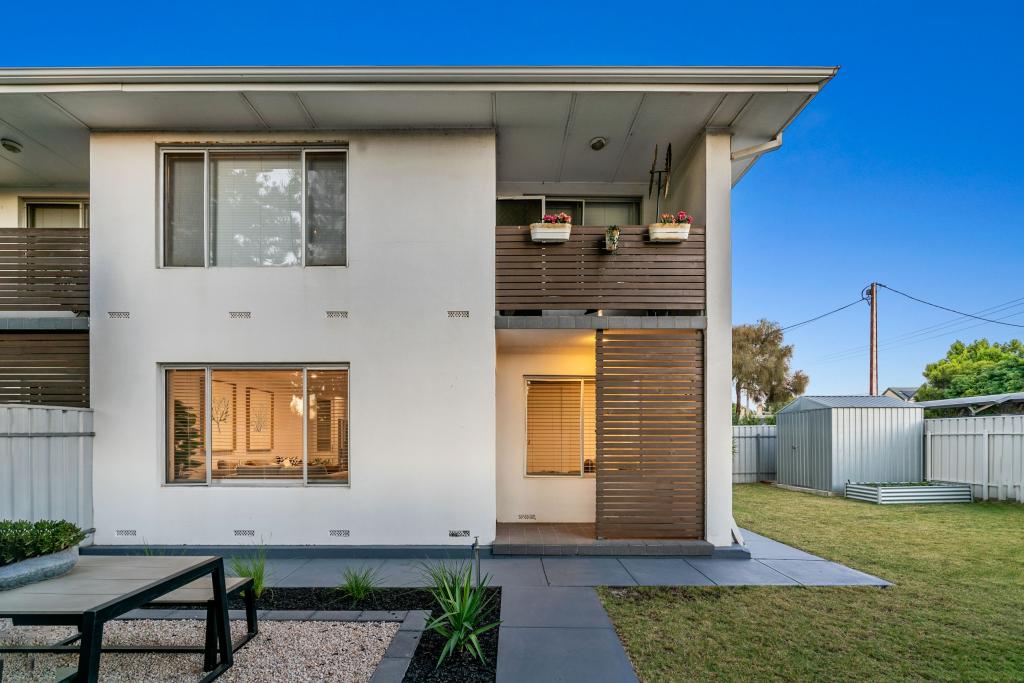 0
0About Henley Beach South 5022
The size of Henley Beach South is approximately 1.1 square kilometres. It has 5 parks covering nearly 10.1% of total area. The population of Henley Beach South in 2011 was 2,501 people. By 2016 the population was 2,674 showing a population growth of 6.9% in the area during that time. The predominant age group in Henley Beach South is 40-49 years. Households in Henley Beach South are primarily couples with children and are likely to be repaying $1800 - $2399 per month on mortgage repayments. In general, people in Henley Beach South work in a professional occupation. In 2011, 62.7% of the homes in Henley Beach South were owner-occupied compared with 63% in 2016.
Henley Beach South has 1,339 properties. Over the last 5 years, Houses in Henley Beach South have seen a 63.01% increase in median value, while Units have seen a 68.79% increase. As at 28 February 2025:
- The median value for Houses in Henley Beach South is $1,559,416 while the median value for Units is $593,681.
- Houses have a median rent of $750 while Units have a median rent of $470.
Suburb Insights for Henley Beach South 5022
Market Insights
Henley Beach South Trends for Houses
N/A
N/A
View TrendN/A
N/A
Henley Beach South Trends for Units
N/A
N/A
View TrendN/A
N/A
Neighbourhood Insights
© Copyright 2025 RP Data Pty Ltd trading as CoreLogic Asia Pacific (CoreLogic). All rights reserved.
This product uses cookies and other similar technologies to improve and customise your browsing experience, to tailor content and adverts, and for analytics and metrics regarding visitor usage on this product and other media. We may share cookie and analytics information with third parties for the purposes of advertising. By continuing to use our website, you consent to cookies being used. View our Privacy Policy here.
X