22 Hazel TerraceHenley Beach South SA 5022
Property Details for 22 Hazel Tce, Henley Beach South
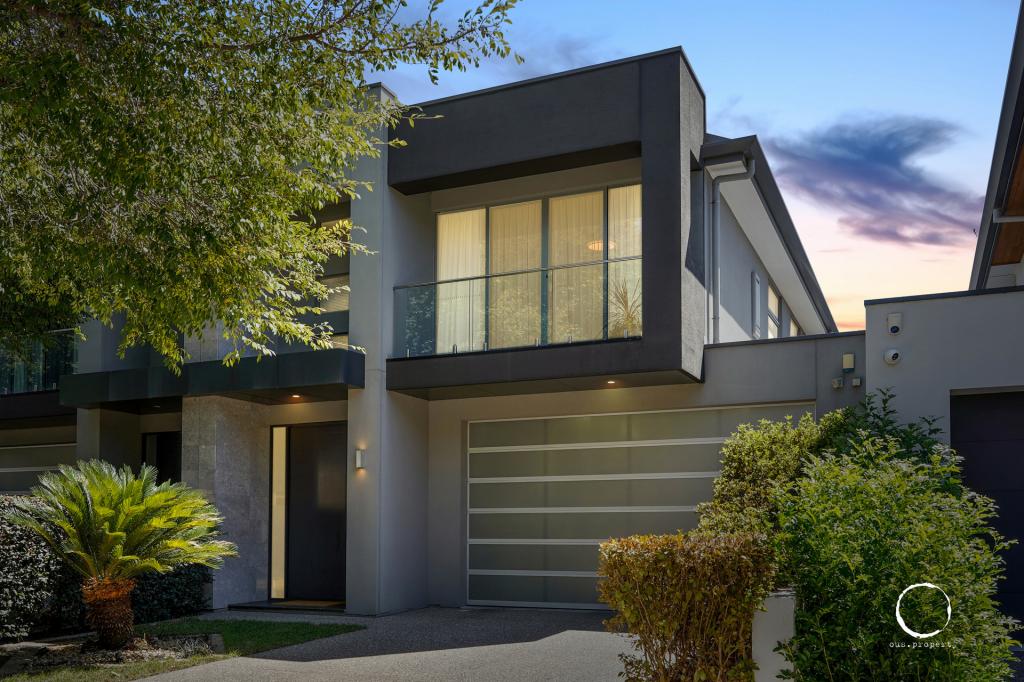
22 Hazel Tce, Henley Beach South is a 5 bedroom, 3 bathroom House with 1 parking spaces and was built in 2013. The property has a land size of 629m2 and floor size of 296m2. While the property is not currently for sale or for rent, it was last sold in June 2009.
Last Listing description (April 2009)
MINUTES TO THE BEACH
PLEASE CALL ANDREW HARVEY 0418 890 395 A MOST ATTRACTIVE FREESTONE FRONTED HOME ON A LARGE ALLOTMENT OF SOME 650 SQM. COMPRISING A FORMAL LOUNGE AND DINING ROOMS, 3 BEDROOMS AND KITCHEN. FEATURES INCLUDE HIGH ORNATE CEILINGS AND POLISHED FLOORBOARDS. PRESENTED IN ORIGINAL BUT GOOD CONDITION. THE PERFECT FLOORPLAN FOR THOSE WHO WISH TO EXTEND. ALSO HAS PLANS AVAILABLE FOR A NEW DOUBLE STOREY HOME. RLA 60113
Property History for 22 Hazel Tce, Henley Beach South, SA 5022
- 27 Jun 2012Listed for Rent - Price not available
- 02 Jul 2011Listed for Rent - Price not available
- 03 Jun 2009Sold for $535,000
Commute Calculator
Recent sales nearby
See more recent sales nearbySimilar properties For Sale nearby
See more properties for sale nearby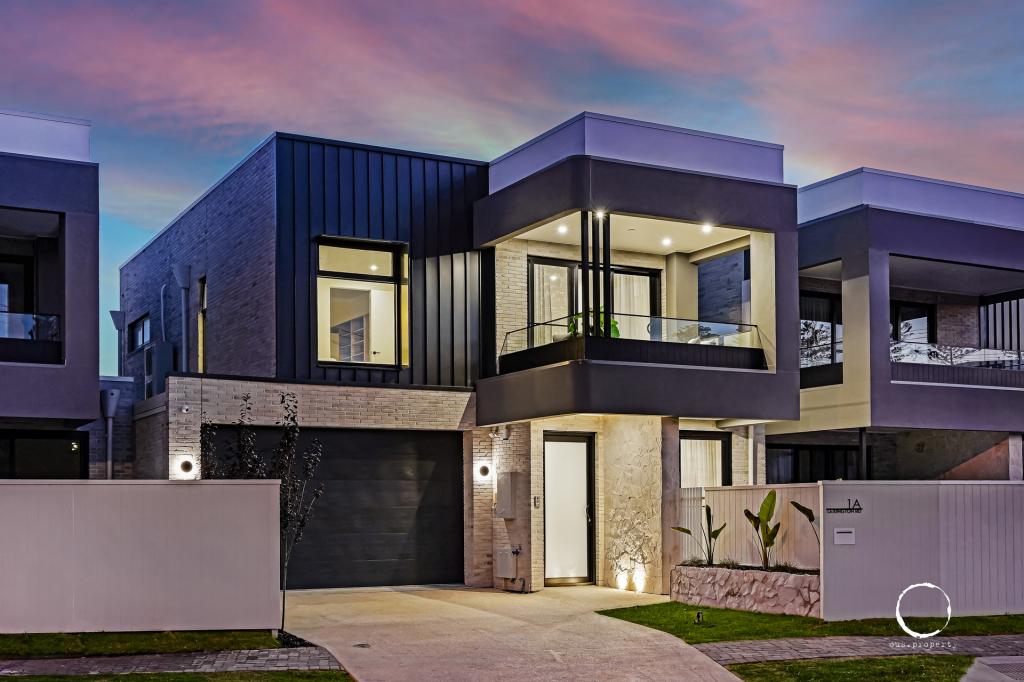 0
0
 0
0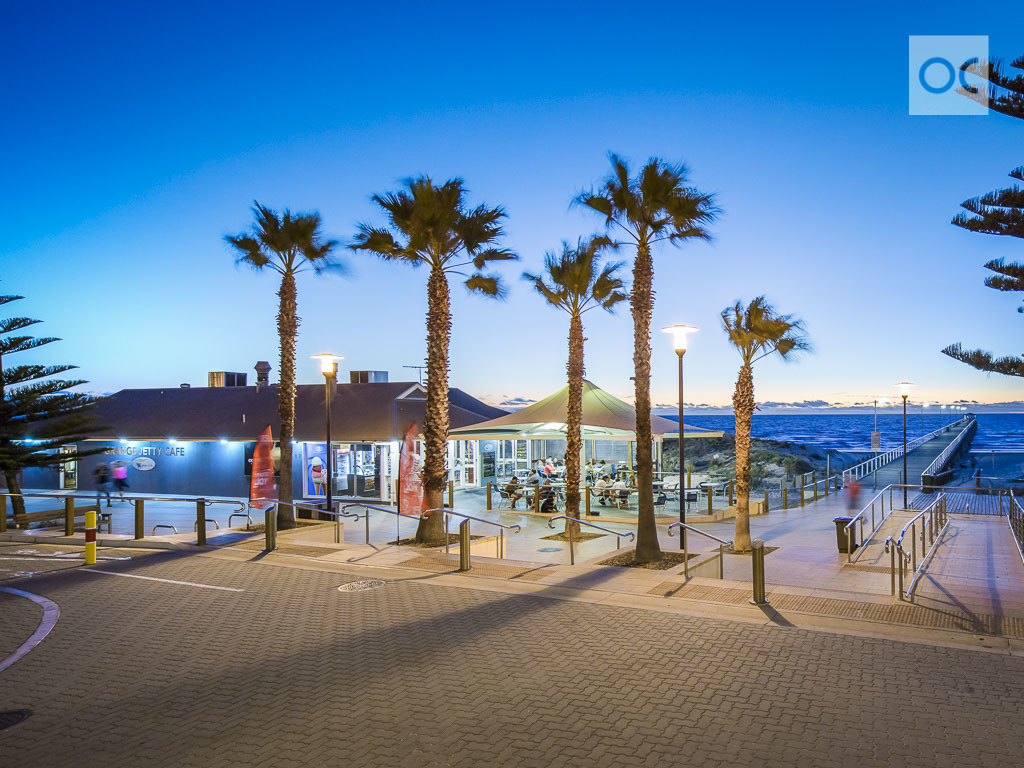 0
0Similar properties For Rent nearby
See more properties for rent nearby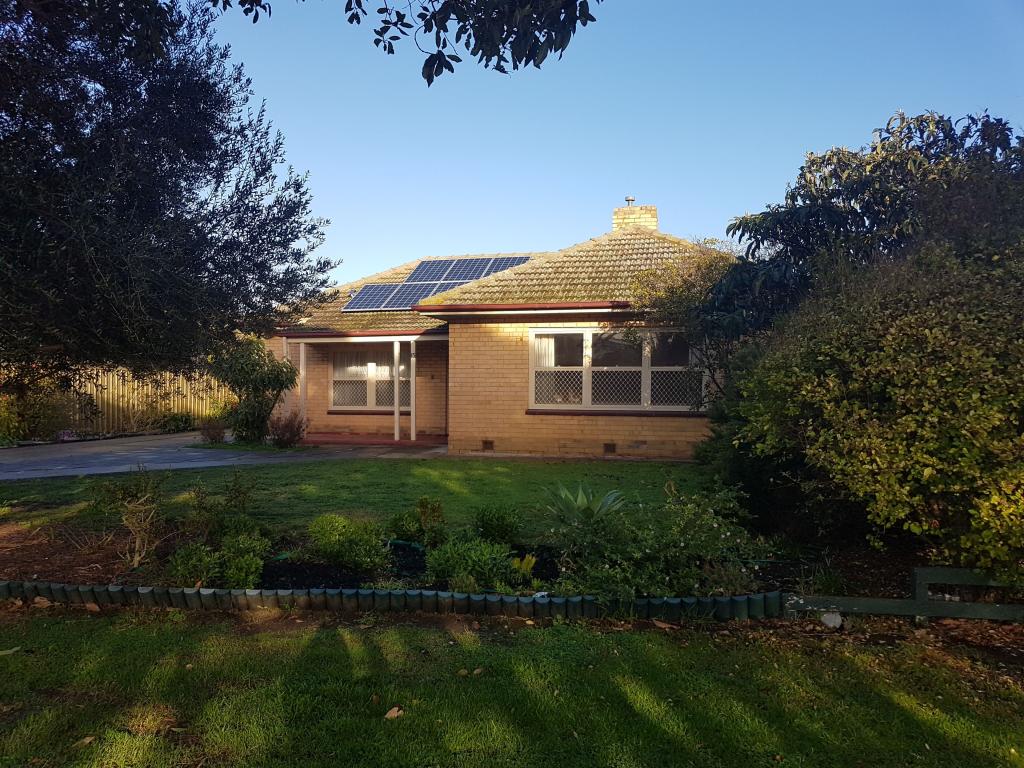 0
0 0
0 0
0
About Henley Beach South 5022
The size of Henley Beach South is approximately 1.1 square kilometres. It has 5 parks covering nearly 10.1% of total area. The population of Henley Beach South in 2011 was 2,501 people. By 2016 the population was 2,674 showing a population growth of 6.9% in the area during that time. The predominant age group in Henley Beach South is 40-49 years. Households in Henley Beach South are primarily couples with children and are likely to be repaying $1800 - $2399 per month on mortgage repayments. In general, people in Henley Beach South work in a professional occupation. In 2011, 62.7% of the homes in Henley Beach South were owner-occupied compared with 63% in 2016.
Henley Beach South has 1,339 properties. Over the last 5 years, Houses in Henley Beach South have seen a 63.04% increase in median value, while Units have seen a 73.42% increase. As at 31 January 2025:
- The median value for Houses in Henley Beach South is $1,521,537 while the median value for Units is $578,995.
- Houses have a median rent of $725 while Units have a median rent of $450.
Suburb Insights for Henley Beach South 5022
Market Insights
Henley Beach South Trends for Houses
N/A
N/A
View TrendN/A
N/A
Henley Beach South Trends for Units
N/A
N/A
View TrendN/A
N/A
Neighbourhood Insights
© Copyright 2025 RP Data Pty Ltd trading as CoreLogic Asia Pacific (CoreLogic). All rights reserved.
This product uses cookies and other similar technologies to improve and customise your browsing experience, to tailor content and adverts, and for analytics and metrics regarding visitor usage on this product and other media. We may share cookie and analytics information with third parties for the purposes of advertising. By continuing to use our website, you consent to cookies being used. View our Privacy Policy here.
X