2/163 Seaview RoadHenley Beach South SA 5022
Property Details for 2/163 Seaview Rd, Henley Beach South
2/163 Seaview Rd, Henley Beach South is a 2 bedroom, 1 bathroom Unit with 1 parking spaces and was built in 1972. The property has a floor size of 64m2.
Last Listing description (November 2014)
WALK TO BEACH & CAFE - FACING PARK-LIKE RESERVE!
An opportunity to secure this beautifully presented 2 bedroom air-cond. unit with balcony outlook on three sides (with a private one at the front).
Featuring modernised kitchen and bathroom, BI robes in main, floating floors and open plan lounge with a great outlook over the school playing fields.
IDEAL FOR INVESTOR OR 1ST HOME BUYERS - READY TO MOVE NOW!
Priced to sell at $240,000 - $260,000
For more details, contact Tony Taddeo 0412 832 959
RLA 1838
Property History for 2/163 Seaview Rd, Henley Beach South, SA 5022
- 03 Sep 2014Listed for Sale NEW PRICE - $240,000 - $260,000
Commute Calculator
Recent sales nearby
See more recent sales nearby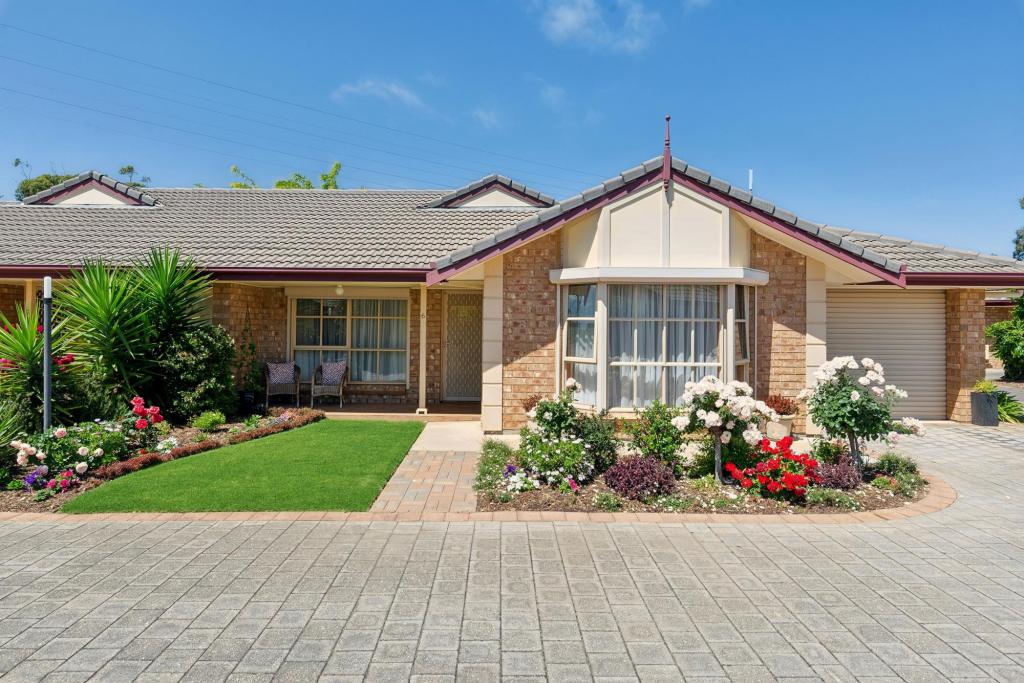 0
0
Similar properties For Sale nearby
See more properties for sale nearby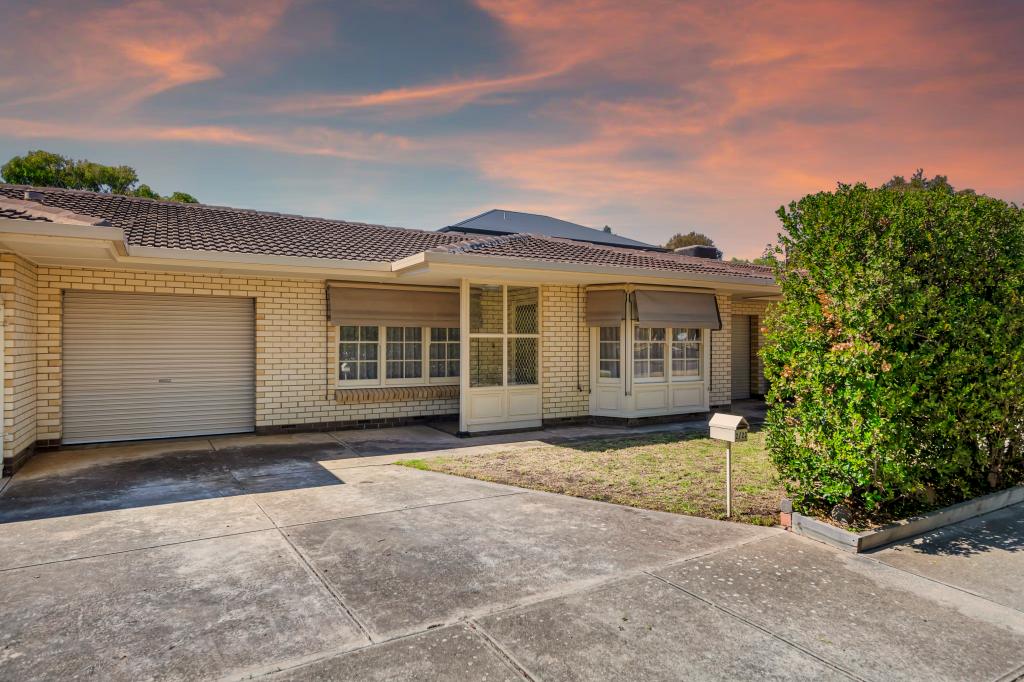 0
0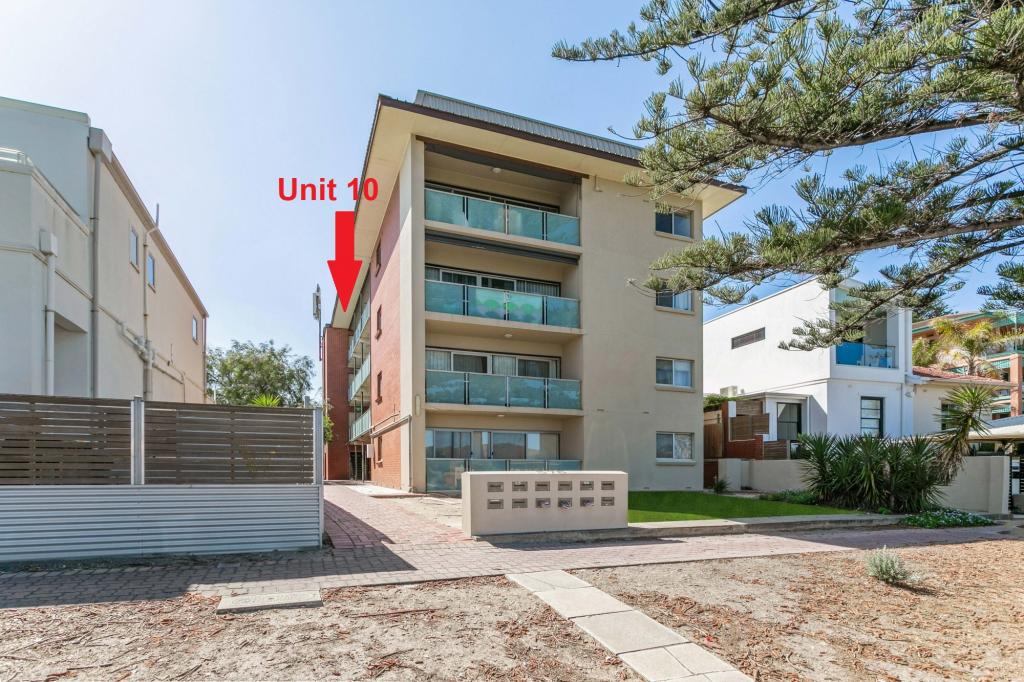 0
0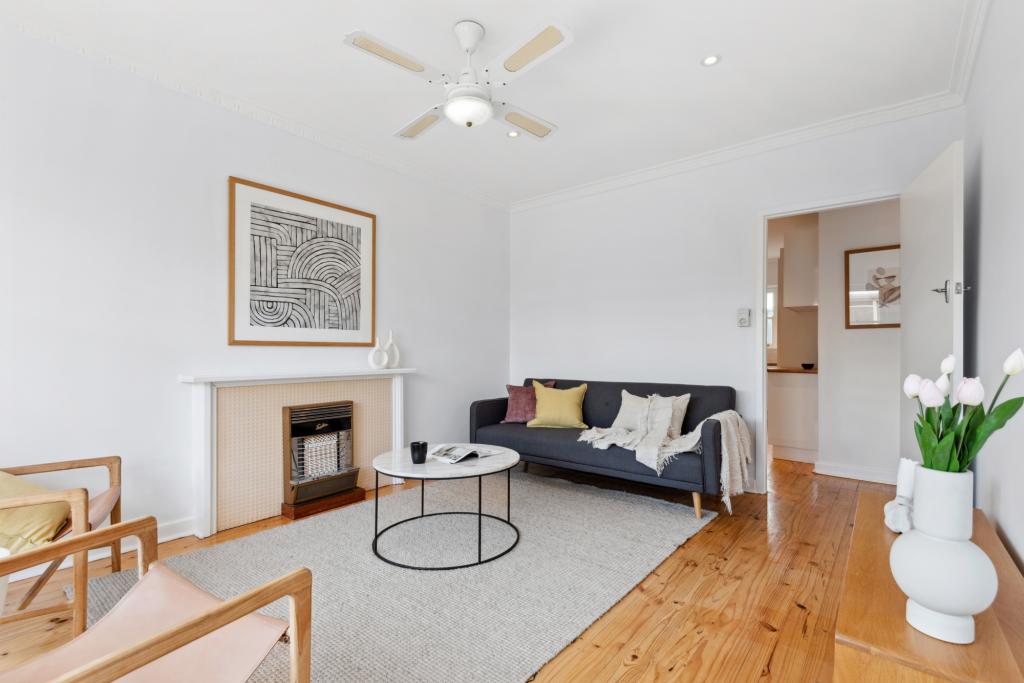 0
0
Similar properties For Rent nearby
See more properties for rent nearby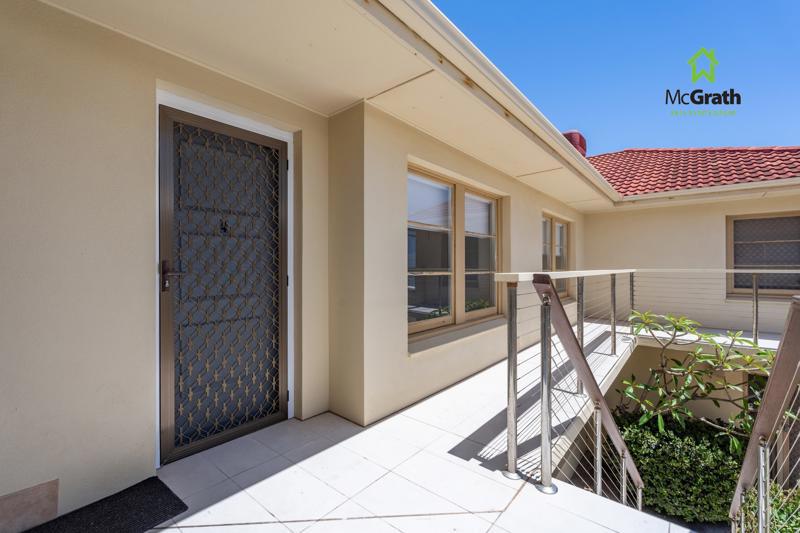 0
0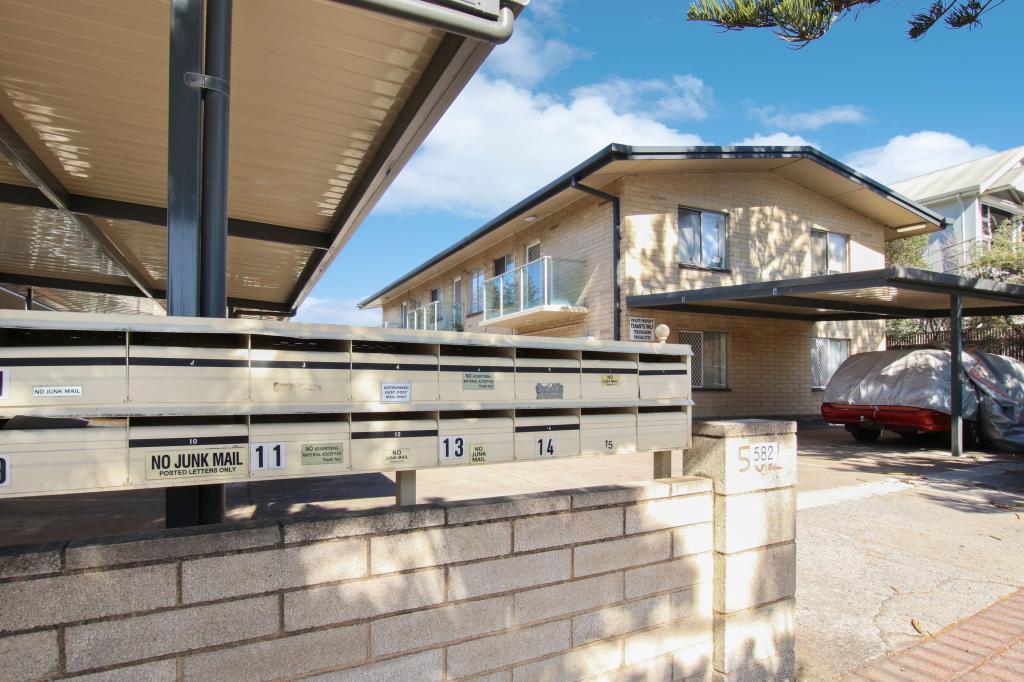 0
0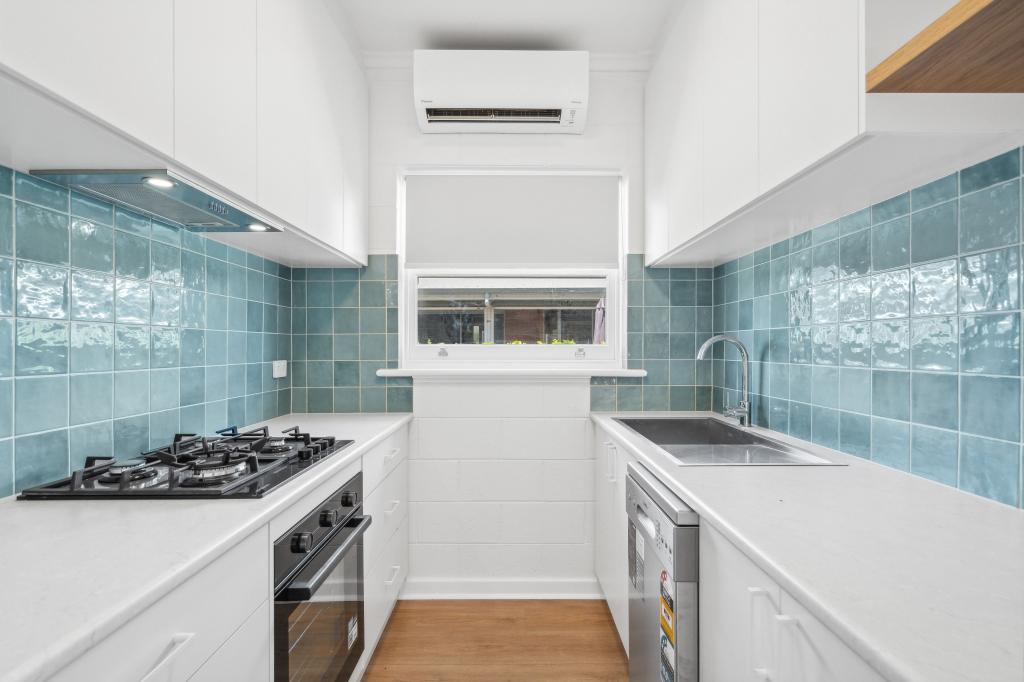 0
0About Henley Beach South 5022
The size of Henley Beach South is approximately 1.1 square kilometres. It has 5 parks covering nearly 10.1% of total area. The population of Henley Beach South in 2011 was 2,501 people. By 2016 the population was 2,674 showing a population growth of 6.9% in the area during that time. The predominant age group in Henley Beach South is 40-49 years. Households in Henley Beach South are primarily couples with children and are likely to be repaying $1800 - $2399 per month on mortgage repayments. In general, people in Henley Beach South work in a professional occupation. In 2011, 62.7% of the homes in Henley Beach South were owner-occupied compared with 63% in 2016.
Henley Beach South has 1,328 properties. Over the last 5 years, Houses in Henley Beach South have seen a 74.37% increase in median value, while Units have seen a 64.14% increase. As at 31 October 2024:
- The median value for Houses in Henley Beach South is $1,607,982 while the median value for Units is $619,428.
- Houses have a median rent of $700 while Units have a median rent of $450.
Suburb Insights for Henley Beach South 5022
Market Insights
Henley Beach South Trends for Houses
N/A
N/A
View TrendN/A
N/A
Henley Beach South Trends for Units
N/A
N/A
View TrendN/A
N/A
Neighbourhood Insights
© Copyright 2024 RP Data Pty Ltd trading as CoreLogic Asia Pacific (CoreLogic). All rights reserved.
This product uses cookies and other similar technologies to improve and customise your browsing experience, to tailor content and adverts, and for analytics and metrics regarding visitor usage on this product and other media. We may share cookie and analytics information with third parties for the purposes of advertising. By continuing to use our website, you consent to cookies being used. View our Privacy Policy here.
X