18 Fletcher RoadHenley Beach South SA 5022
Property Details for 18 Fletcher Rd, Henley Beach South
18 Fletcher Rd, Henley Beach South is a 3 bedroom, 1 bathroom House with 2 parking spaces and was built in 1958. The property has a land size of 666m2 and floor size of 275m2. While the property is not currently for sale or for rent, it was last sold in June 2017.
Last Listing description (July 2017)
Comfy 3 bedroom home or a valuable corner allotment of approx 667sqm overlooking park and just a short stroll to the beach, schools and most services.
Whether you want to live in as is, add some further polish or redevelop (stcc) this rare opportunity is one not to be missed!
When location is everything.... This is it!
Price Guide $650,000
Auction Saturday 8th April at 11am.
Property History for 18 Fletcher Rd, Henley Beach South, SA 5022
- 01 Jun 2017Sold for $790,000
- 14 Mar 2017Listed for Sale Auction
- 11 Dec 2015Listed for Rent - Price not available
Commute Calculator
Recent sales nearby
See more recent sales nearbySimilar properties For Sale nearby
See more properties for sale nearby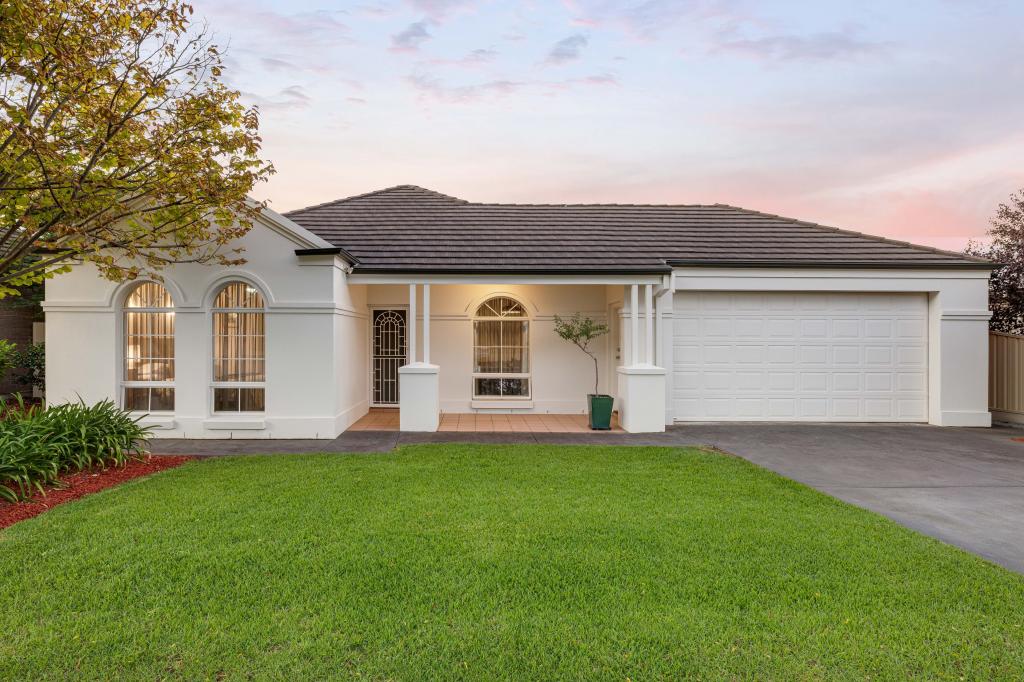 0
0 0
0
 0
0
Similar properties For Rent nearby
See more properties for rent nearby 0
0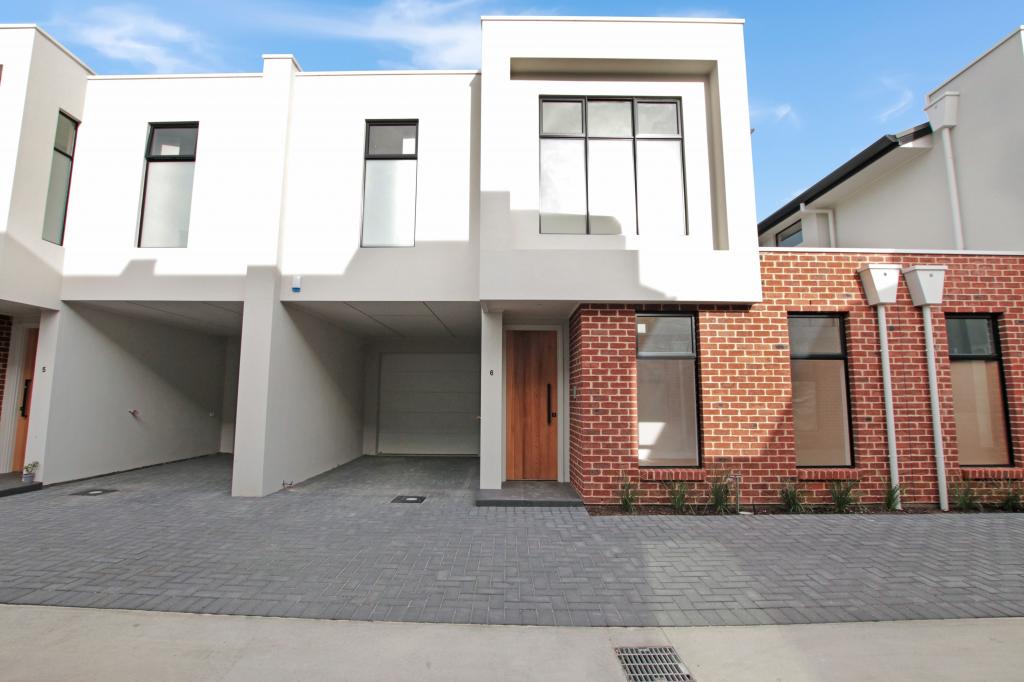 0
0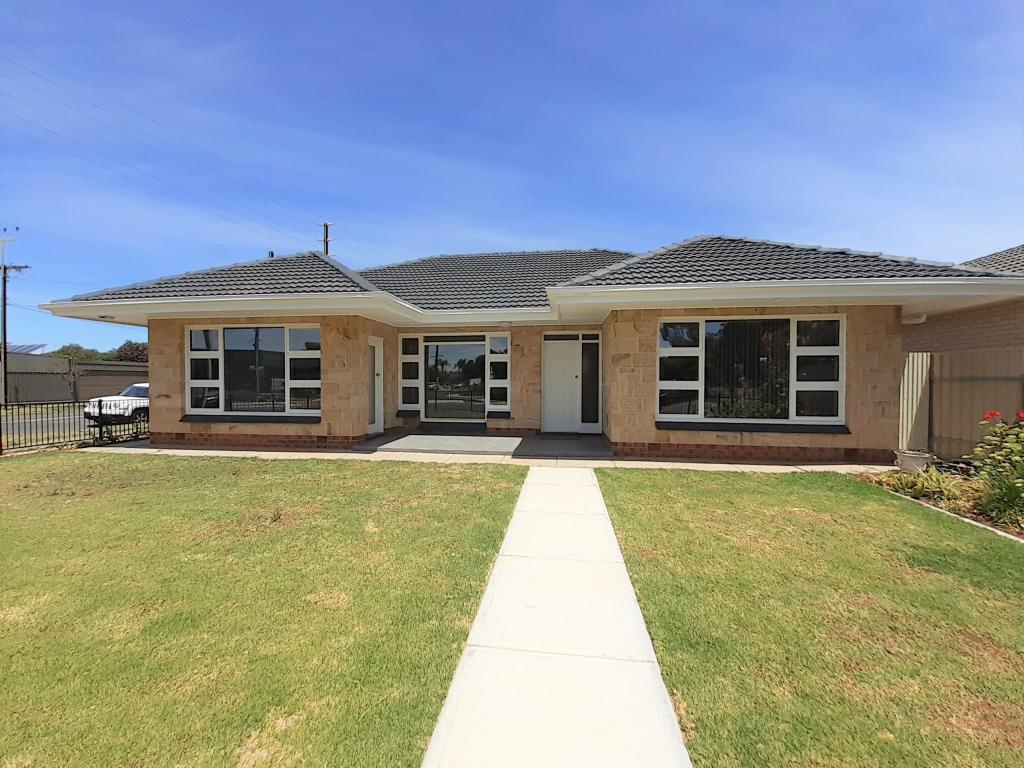 0
0About Henley Beach South 5022
The size of Henley Beach South is approximately 1.1 square kilometres. It has 5 parks covering nearly 10.1% of total area. The population of Henley Beach South in 2011 was 2,501 people. By 2016 the population was 2,674 showing a population growth of 6.9% in the area during that time. The predominant age group in Henley Beach South is 40-49 years. Households in Henley Beach South are primarily couples with children and are likely to be repaying $1800 - $2399 per month on mortgage repayments. In general, people in Henley Beach South work in a professional occupation. In 2011, 62.7% of the homes in Henley Beach South were owner-occupied compared with 63% in 2016.
Henley Beach South has 1,339 properties. Over the last 5 years, Houses in Henley Beach South have seen a 63.01% increase in median value, while Units have seen a 68.79% increase. As at 28 February 2025:
- The median value for Houses in Henley Beach South is $1,559,416 while the median value for Units is $593,681.
- Houses have a median rent of $750 while Units have a median rent of $470.
Suburb Insights for Henley Beach South 5022
Market Insights
Henley Beach South Trends for Houses
N/A
N/A
View TrendN/A
N/A
Henley Beach South Trends for Units
N/A
N/A
View TrendN/A
N/A
Neighbourhood Insights
© Copyright 2025 RP Data Pty Ltd trading as CoreLogic Asia Pacific (CoreLogic). All rights reserved.
This product uses cookies and other similar technologies to improve and customise your browsing experience, to tailor content and adverts, and for analytics and metrics regarding visitor usage on this product and other media. We may share cookie and analytics information with third parties for the purposes of advertising. By continuing to use our website, you consent to cookies being used. View our Privacy Policy here.
X