17 Hazel TerraceHenley Beach South SA 5022
Property Details for 17 Hazel Tce, Henley Beach South
17 Hazel Tce, Henley Beach South is a 3 bedroom, 1 bathroom House with 2 parking spaces and was built in 1964. The property has a land size of 664m2 and floor size of 102m2. While the property is not currently for sale or for rent, it was last sold in July 2010.
Last Listing description (May 2010)
OPPORTUNITY KNOCKS FOR THE ASTUTE BUYER - WALK TO BEACH, SHOPS & CAFE'S
THIS DELIGHTFUL SOLID BRICK HOME FEATURES 3 GENEROUS SIZE BEDROOMS WITH BUILT IN ROBES, LIGHT FILLED FORMAL LOUNGE, MODERN BLACK-WOOD TIMBER KITCHEN AND MEALS AREA, DUCTED REVERSE CYCLE AIR-CONDITIONING, DETACHED SUN ROOM WITH SPA BATH, DOUBLE BRICK GARAGE WITH HIGH SPAN PLUS CARPORT UNDER MAIN ROOF ALL SITED ON AN EASY CARE ALLOTMENT OF APPROXIMATELY 662M2. EASY WALK TO SHOPS, CAFES, TRANSPORT AND ONLY 400M TO THE BEACH. FABULOUS LIVING HERE!! RLA 183 154
Property History for 17 Hazel Tce, Henley Beach South, SA 5022
- 02 Dec 2011Listed for Rent - Price not available
- 16 Jul 2011Listed for Rent - Price not available
- 01 Jul 2010Sold for $595,000
Commute Calculator
Recent sales nearby
See more recent sales nearbySimilar properties For Sale nearby
See more properties for sale nearby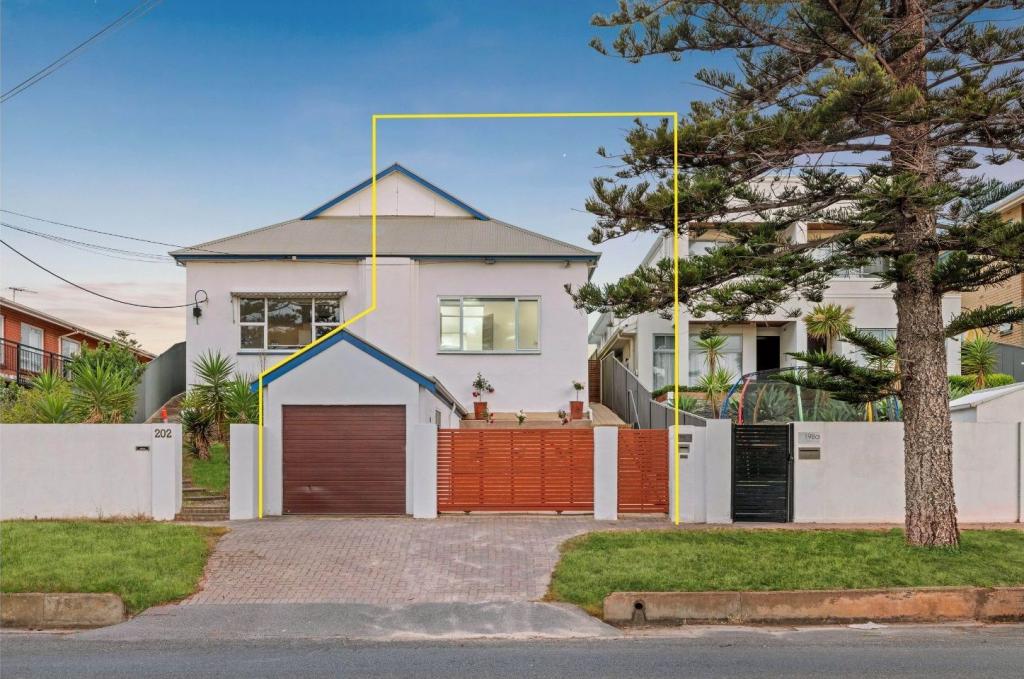 0
0
 0
0
 0
0Similar properties For Rent nearby
See more properties for rent nearby 0
0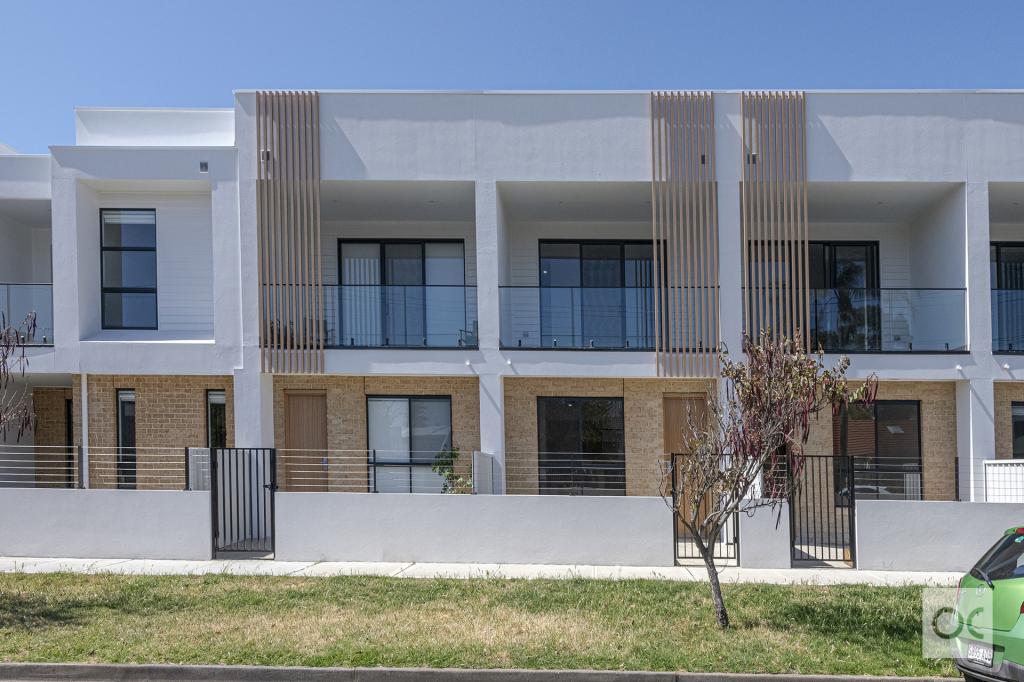 0
0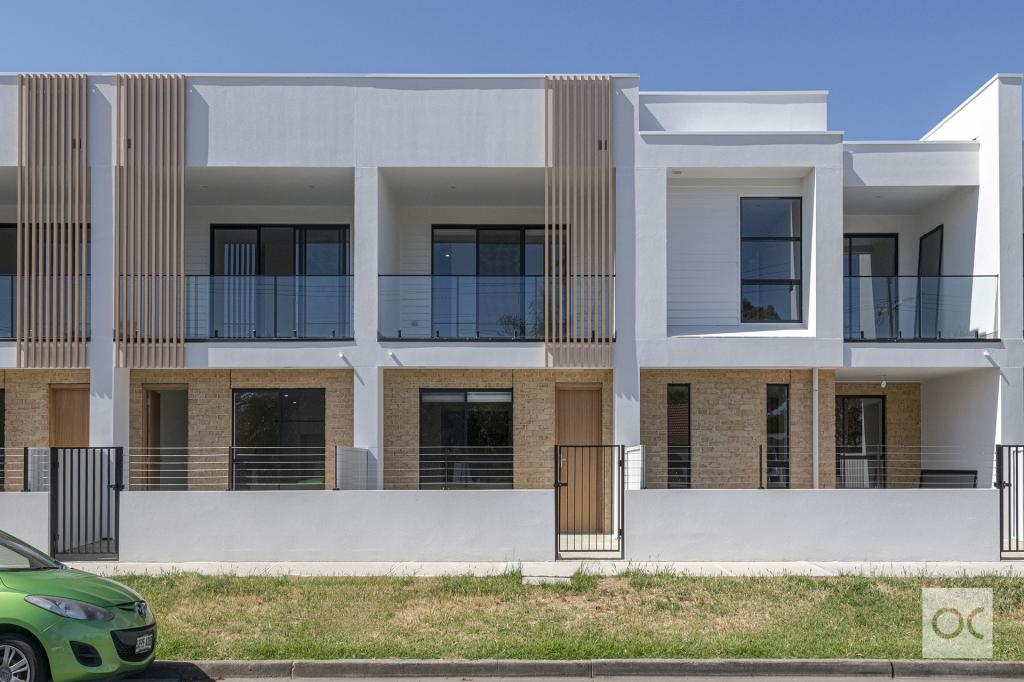 0
0About Henley Beach South 5022
The size of Henley Beach South is approximately 1.1 square kilometres. It has 5 parks covering nearly 10.1% of total area. The population of Henley Beach South in 2011 was 2,501 people. By 2016 the population was 2,674 showing a population growth of 6.9% in the area during that time. The predominant age group in Henley Beach South is 40-49 years. Households in Henley Beach South are primarily couples with children and are likely to be repaying $1800 - $2399 per month on mortgage repayments. In general, people in Henley Beach South work in a professional occupation. In 2011, 62.7% of the homes in Henley Beach South were owner-occupied compared with 63% in 2016.
Henley Beach South has 1,329 properties. Over the last 5 years, Houses in Henley Beach South have seen a 74.37% increase in median value, while Units have seen a 64.14% increase. As at 31 October 2024:
- The median value for Houses in Henley Beach South is $1,607,982 while the median value for Units is $619,428.
- Houses have a median rent of $700 while Units have a median rent of $450.
Suburb Insights for Henley Beach South 5022
Market Insights
Henley Beach South Trends for Houses
N/A
N/A
View TrendN/A
N/A
Henley Beach South Trends for Units
N/A
N/A
View TrendN/A
N/A
Neighbourhood Insights
© Copyright 2024 RP Data Pty Ltd trading as CoreLogic Asia Pacific (CoreLogic). All rights reserved.
This product uses cookies and other similar technologies to improve and customise your browsing experience, to tailor content and adverts, and for analytics and metrics regarding visitor usage on this product and other media. We may share cookie and analytics information with third parties for the purposes of advertising. By continuing to use our website, you consent to cookies being used. View our Privacy Policy here.
X