132A Seaview RoadHenley Beach South SA 5022
Property Details for 132a Seaview Rd, Henley Beach South
132a Seaview Rd, Henley Beach South is a 1 bedroom, 1 bathroom Unit with 1 parking spaces and was built in 1950. The property has a land size of 581m2 and floor size of 201m2. While the property is not currently for sale or for rent, it was last sold in November 1993.
Last Listing description (May 2019)
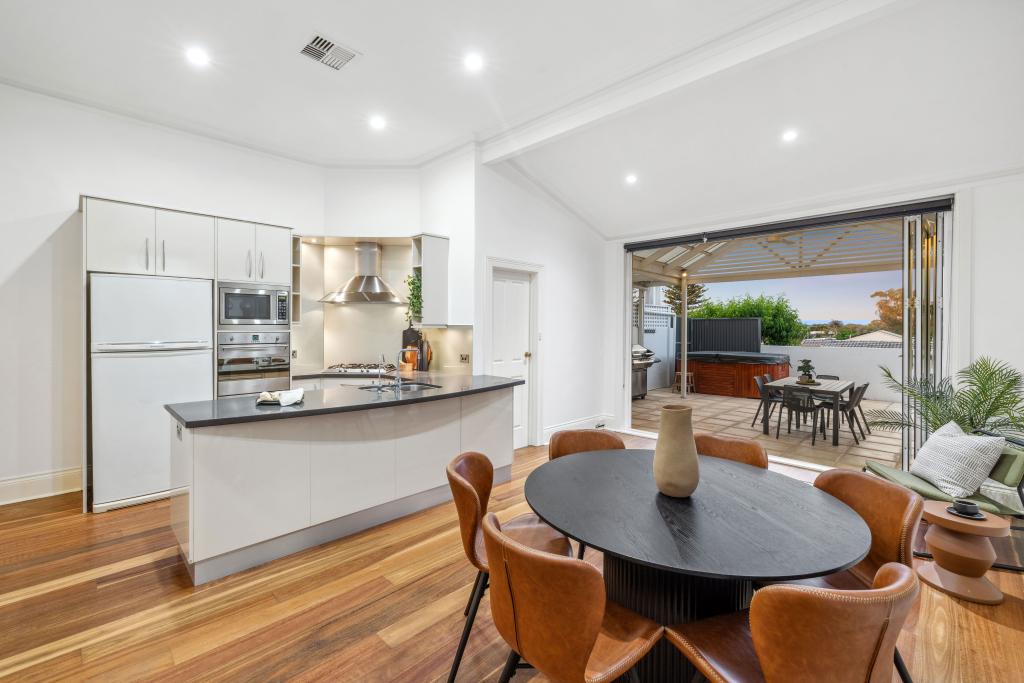
Fully refurbished unit with new kitchen and floor coverings throughout.
Lounge, dining, bedroom with large built in wardrobe, renovated bathroom . Laundry
Walk across the road to beautiful Tennyson beach or take a stroll around the Lake.
To book an inspection please use the RED 'Contact Agent' tab (on a desktop) or RED 'Contact Agent' (on an Android, iPhone or iPad) which will go directly to the person managing the property.
Property History for 132a Seaview Rd, Henley Beach South, SA 5022
- 10 Apr 2019Listed for Rent $275 / week
- 22 Nov 1993Sold for $170,000
Commute Calculator
Recent sales nearby
See more recent sales nearby 0
0
Similar properties For Sale nearby
See more properties for sale nearby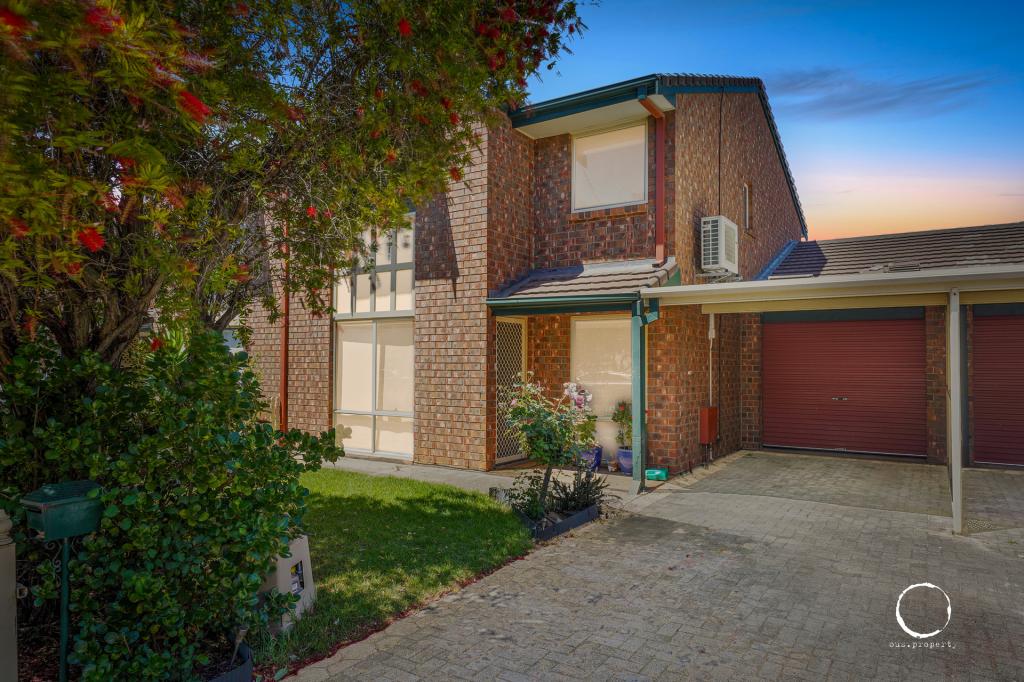 0
0
 0
0
 0
0Similar properties For Rent nearby
See more properties for rent nearby 0
0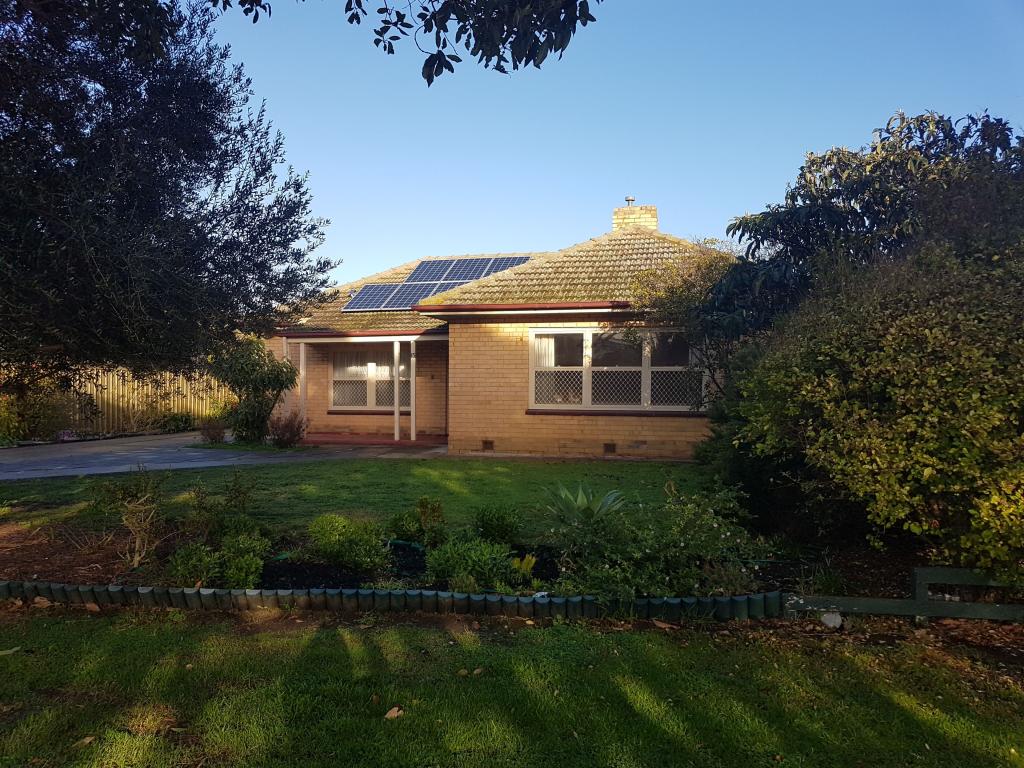 0
0 0
0About Henley Beach South 5022
The size of Henley Beach South is approximately 1.1 square kilometres. It has 5 parks covering nearly 10.1% of total area. The population of Henley Beach South in 2011 was 2,501 people. By 2016 the population was 2,674 showing a population growth of 6.9% in the area during that time. The predominant age group in Henley Beach South is 40-49 years. Households in Henley Beach South are primarily couples with children and are likely to be repaying $1800 - $2399 per month on mortgage repayments. In general, people in Henley Beach South work in a professional occupation. In 2011, 62.7% of the homes in Henley Beach South were owner-occupied compared with 63% in 2016.
Henley Beach South has 1,328 properties. Over the last 5 years, Houses in Henley Beach South have seen a 74.37% increase in median value, while Units have seen a 64.14% increase. As at 31 October 2024:
- The median value for Houses in Henley Beach South is $1,607,982 while the median value for Units is $619,428.
- Houses have a median rent of $700 while Units have a median rent of $450.
Suburb Insights for Henley Beach South 5022
Market Insights
Henley Beach South Trends for Houses
N/A
N/A
View TrendN/A
N/A
Henley Beach South Trends for Units
N/A
N/A
View TrendN/A
N/A
Neighbourhood Insights
© Copyright 2024 RP Data Pty Ltd trading as CoreLogic Asia Pacific (CoreLogic). All rights reserved.
This product uses cookies and other similar technologies to improve and customise your browsing experience, to tailor content and adverts, and for analytics and metrics regarding visitor usage on this product and other media. We may share cookie and analytics information with third parties for the purposes of advertising. By continuing to use our website, you consent to cookies being used. View our Privacy Policy here.
X