35 East TerraceHenley Beach SA 5022
Property Details for 35 East Tce, Henley Beach
35 East Tce, Henley Beach is a 3 bedroom, 2 bathroom House with 1 parking spaces and was built in 2019. The property has a land size of 105m2. While the property is not currently for sale or for rent, it was last sold in December 2020.
Last Listing description (August 2022)
Sold By Rosemary Auricchio & The Team At LJ Hooker West Lakes / Henley Beach. Contact Rosemary on 0418 656 386 to find out how we can help move you.
Disclaimer:
Property History for 35 East Tce, Henley Beach, SA 5022
- 02 Aug 2022Listed for Sale Sold
- 05 May 2021Listed for Sale Sold
- 17 Mar 2021Listed for Rent $520 / week
Commute Calculator
Recent sales nearby
See more recent sales nearby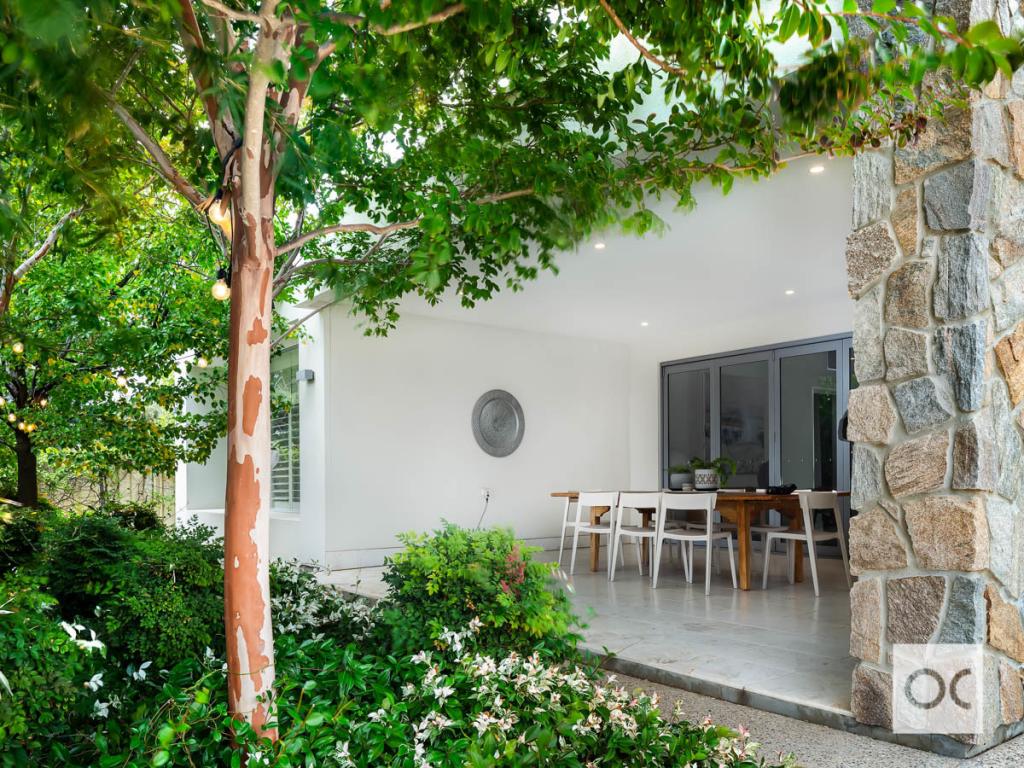 0
0Similar properties For Sale nearby
See more properties for sale nearby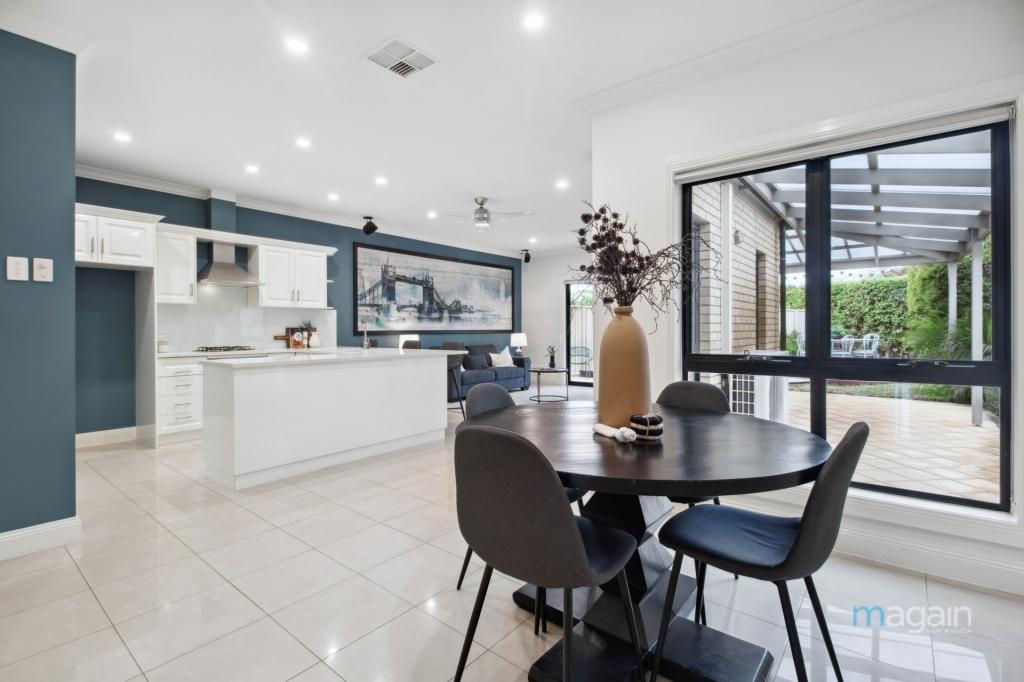 0
0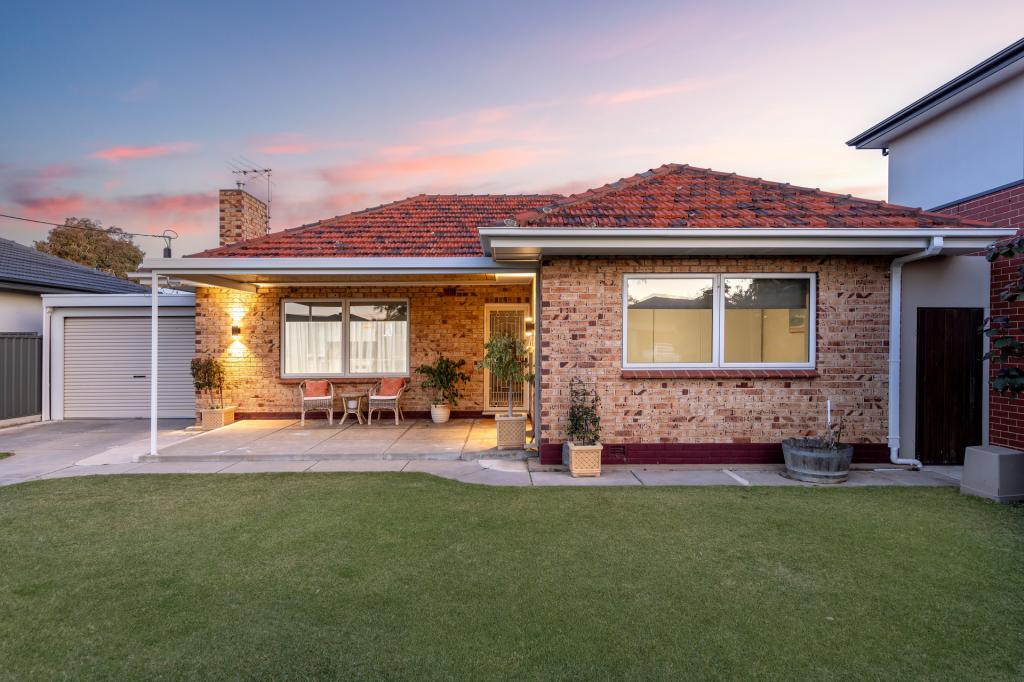 0
0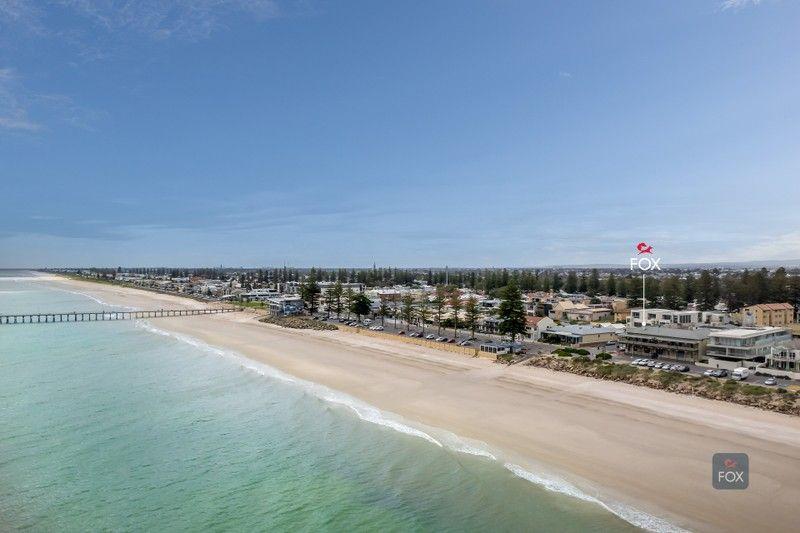 0
0Similar properties For Rent nearby
See more properties for rent nearby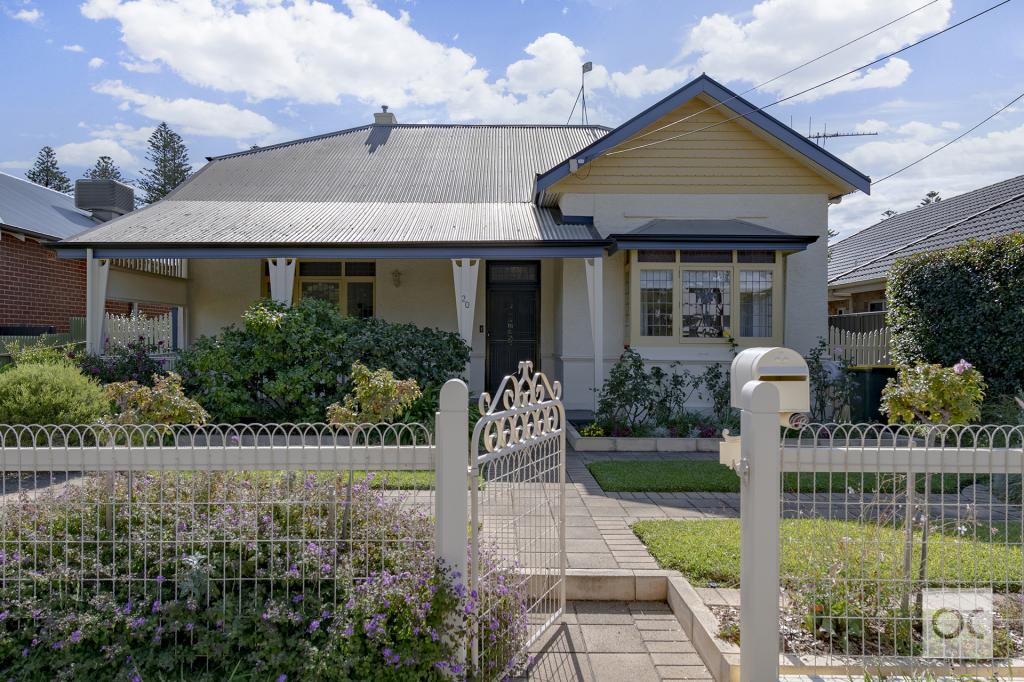 0
0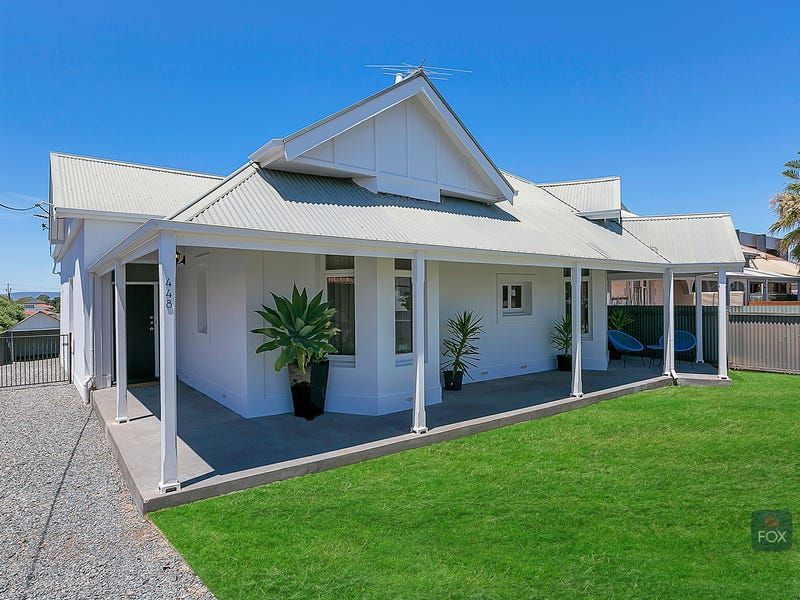 0
0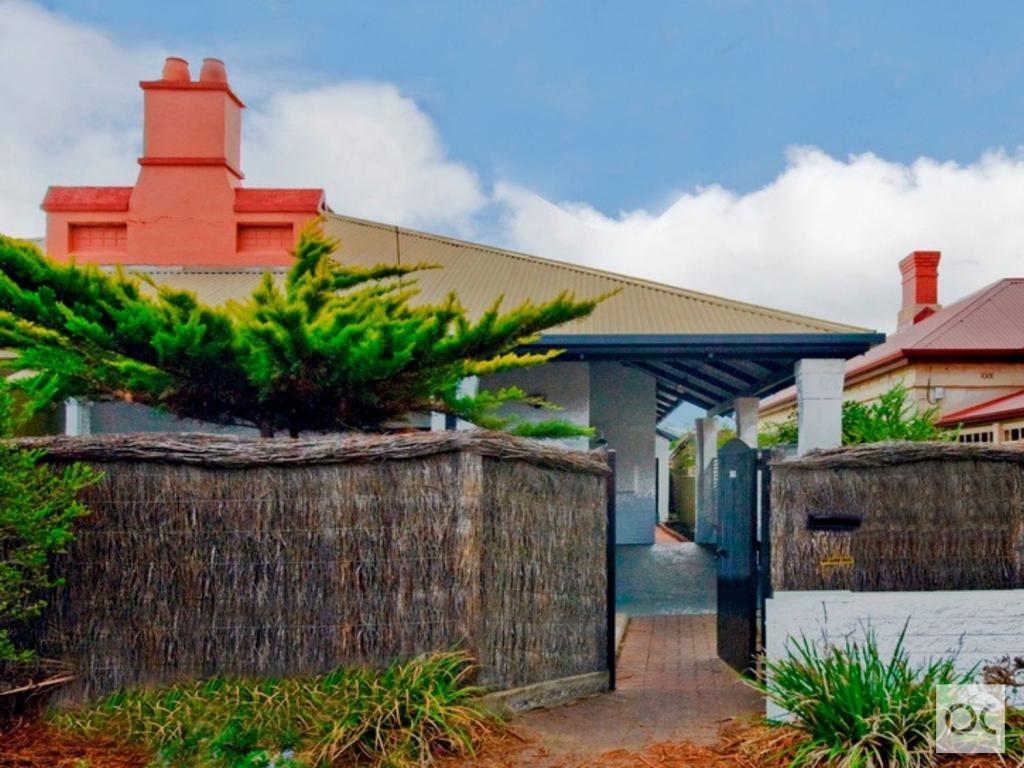 0
0About Henley Beach 5022
The size of Henley Beach is approximately 2.7 square kilometres. It has 9 parks covering nearly 8.5% of total area. The population of Henley Beach in 2011 was 5,562 people. By 2016 the population was 5,997 showing a population growth of 7.8% in the area during that time. The predominant age group in Henley Beach is 40-49 years. Households in Henley Beach are primarily couples with children and are likely to be repaying $1800 - $2399 per month on mortgage repayments. In general, people in Henley Beach work in a professional occupation. In 2011, 66.3% of the homes in Henley Beach were owner-occupied compared with 65.7% in 2016.
Henley Beach has 3,220 properties.
Suburb Insights for Henley Beach 5022
Market Insights
Trends for Houses
N/A
N/A
View TrendN/A
N/A
Trends for Units
N/A
N/A
View TrendN/A
N/A
Neighbourhood Insights
© Copyright 2024 RP Data Pty Ltd trading as CoreLogic Asia Pacific (CoreLogic). All rights reserved.
This product uses cookies and other similar technologies to improve and customise your browsing experience, to tailor content and adverts, and for analytics and metrics regarding visitor usage on this product and other media. We may share cookie and analytics information with third parties for the purposes of advertising. By continuing to use our website, you consent to cookies being used. View our Privacy Policy here.
X