4/3 Farrell StreetGlenelg South SA 5045
Property Details for 4/3 Farrell St, Glenelg South
4/3 Farrell St, Glenelg South is a 3 bedroom, 1 bathroom Unit with 1 parking spaces and was built in 1982. The property has a floor size of 115m2. While the property is not currently for sale or for rent, it was last sold in February 2010.
Last Listing description (January 2010)
Delightful single level 3 bedroom rear unit in small, attractive group. Fabulous beachside location! A leisurely stroll to the beach, shops, bus and cafes will make living here a dream! Open plan lounge/meals/kitchen, sliding doors to the private courtyard with pergola, bathroom with shower, bath and separate toilet and separate laundry. A SPECIAL BONUS of this unit is the 2nd entry from Patawilya Grove including private driveway, carport with roller door and extra parking! Often sought ............. rarely found!
Click here for more information
Property History for 4/3 Farrell St, Glenelg South, SA 5045
- 16 Feb 2010Sold for $500,000
- 19 Dec 2009Listed for Sale PRICE ON APPLICATION
- 04 Apr 1996Sold for $156,000
Commute Calculator
Recent sales nearby
See more recent sales nearbySimilar properties For Sale nearby
See more properties for sale nearby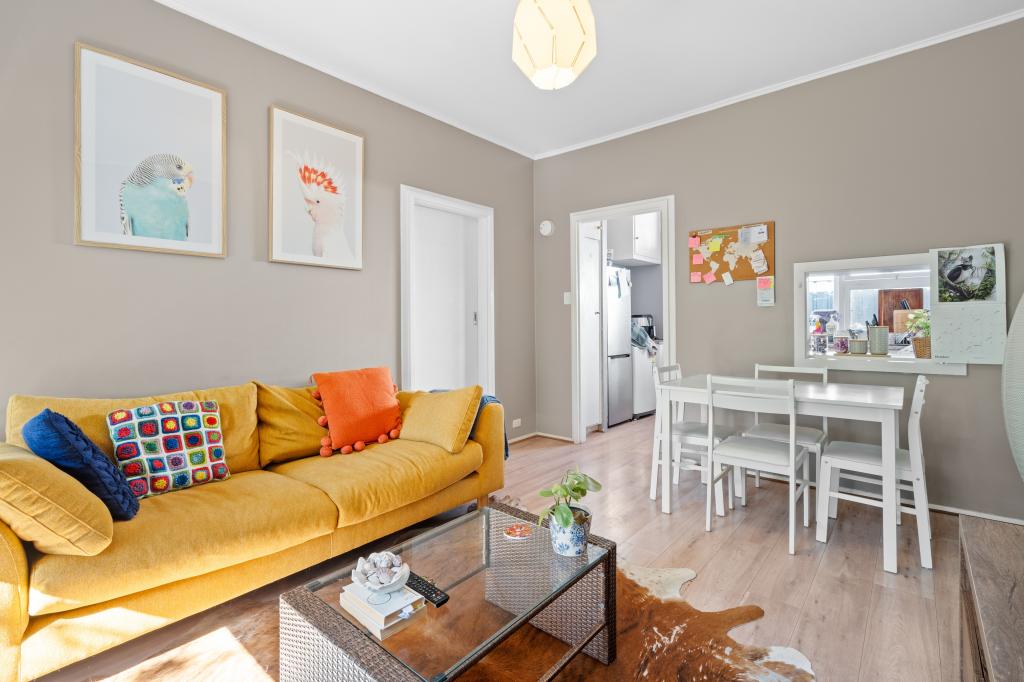 0
0 0
0 0
0Similar properties For Rent nearby
See more properties for rent nearby 0
0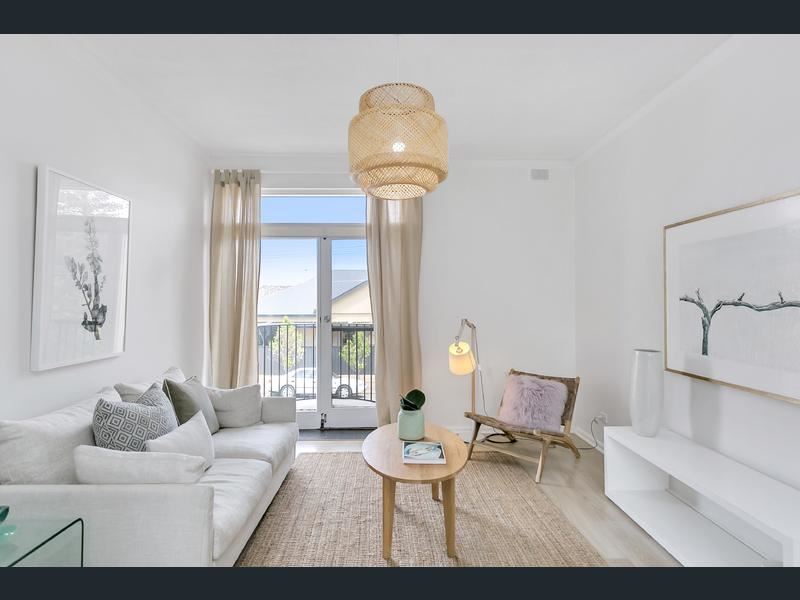 0
0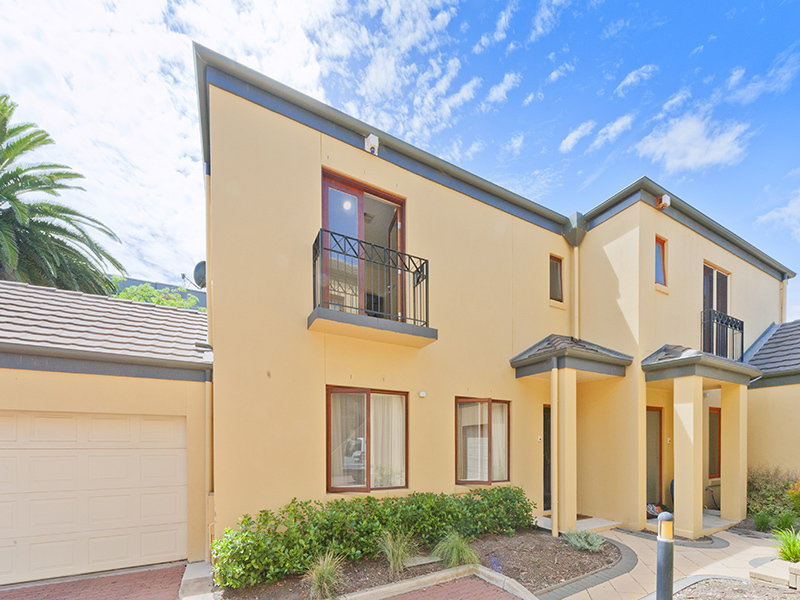 0
0About Glenelg South 5045
The size of Glenelg South is approximately 0.7 square kilometres. It has 4 parks covering nearly 1.6% of total area. The population of Glenelg South in 2011 was 2,339 people. By 2016 the population was 2,244 showing a population decline of 4.1% in the area during that time. The predominant age group in Glenelg South is 50-59 years. Households in Glenelg South are primarily childless couples and are likely to be repaying $1800 - $2399 per month on mortgage repayments. In general, people in Glenelg South work in a professional occupation. In 2011, 54.8% of the homes in Glenelg South were owner-occupied compared with 55.4% in 2016.
Glenelg South has 1,271 properties. Over the last 5 years, Houses in Glenelg South have seen a 99.79% increase in median value, while Units have seen a 73.38% increase. As at 30 September 2024:
- The median value for Houses in Glenelg South is $1,996,672 while the median value for Units is $714,707.
- Houses have a median rent of $685 while Units have a median rent of $480.
Suburb Insights for Glenelg South 5045
Market Insights
Glenelg South Trends for Houses
N/A
N/A
View TrendN/A
N/A
Glenelg South Trends for Units
N/A
N/A
View TrendN/A
N/A
Neighbourhood Insights
© Copyright 2024 RP Data Pty Ltd trading as CoreLogic Asia Pacific (CoreLogic). All rights reserved.
This product uses cookies and other similar technologies to improve and customise your browsing experience, to tailor content and adverts, and for analytics and metrics regarding visitor usage on this product and other media. We may share cookie and analytics information with third parties for the purposes of advertising. By continuing to use our website, you consent to cookies being used. View our Privacy Policy here.
X