OFF MARKET
Are you the owner?

32/3 Noblet Street
Findon SA 5023

Bedrooms: 2
Bathrooms: 1
Car spaces: 1
Floor area: 60m2
Land area: 57m2
Estimated Value & Rent
Estimated Value
Estimated Rent
Medium Confidence
Last updated 17 Mar 2025
Low

High
$375k
$400k
Save

Property Details for 32/3 Noblet St, Findon

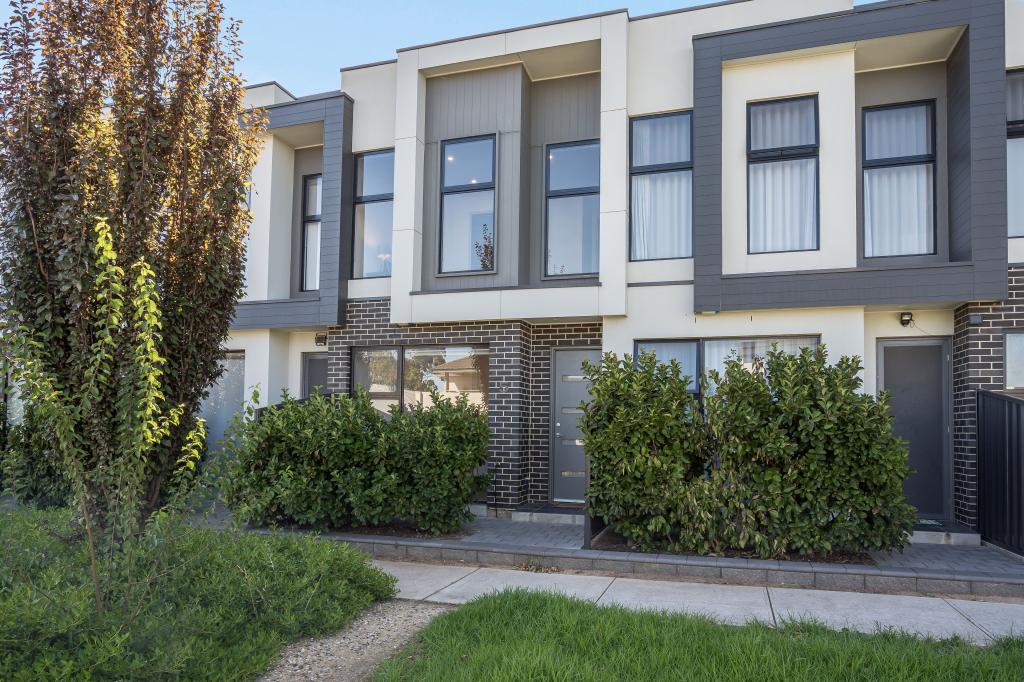
32/3 Noblet St, Findon is a 2 bedroom, 1 bathroom Unit with 1 parking spaces and was built in 1974. The property has a land size of 57m2 and floor size of 60m2. While the property is not currently for sale or for rent, it was last sold in April 2003.

Building Type
Unit
Year Built
1974
Floor Size
60m2
Land Size
57m2
Local Government
Charles Sturt
Lot/Plan
U32/S6265

Last Listing description (September 2015)

2 bedroom upstairs unit, close to the Findon Shopping Centre, schools and transport.
Short term lease also available.
Sorry no pets.

Please call to inspect 8268 3288.
RLA 1838

Property History for 32/3 Noblet St, Findon, SA 5023

A timeline of how this property has performed in the market
Last Sold
$86,000
29 Apr 2003
Listed for Rent
$220/w
11 Sep 2015
  • 21 Jul 2015
    Listed for Rent - Price not available
  • 08 Mar 2012
    Listed for Rent - Price not available
  • 08 Apr 2011
    Listed for Rent - Price not available
Sign in to see more transactions

Commute Calculator

Where to?
-
-
-
-

About Findon 5023

The size of Findon is approximately 2.4 square kilometres. It has 9 parks covering nearly 4.4% of total area. The population of Findon in 2011 was 5,718 people. By 2016 the population was 6,219 showing a population growth of 8.8% in the area during that time. The predominant age group in Findon is 30-39 years. Households in Findon are primarily couples with children and are likely to be repaying $1800 - $2399 per month on mortgage repayments. In general, people in Findon work in a professional occupation. In 2011, 58% of the homes in Findon were owner-occupied compared with 58.5% in 2016.

Findon has 3,753 properties. Over the last 5 years, Houses in Findon have seen a 73.06% increase in median value, while Units have seen a 87.72% increase. As at 28 February 2025:

  • The median value for Houses in Findon is $945,708 while the median value for Units is $588,611.
  • Houses have a median rent of $620 while Units have a median rent of $518.
There are currently 17 properties listed for sale, and 5 properties listed for rent in Findon on OnTheHouse. According to CoreLogic's data, 192 properties were sold in the past 12 months in Findon.

What's around 32/3 Noblet St, Findon

32/3 Noblet St, Findon is in the school catchment zone for Findon High School.

Nearby Schools
Comparable Properties
Our Lady of La Vang School
0.48km
Flinders Park 5025
SpecialNon-GovernmentCombined59 Enrolled
Findon High School
0.86km
Findon 5023
IN CATCHMENTSecondaryGovernment8 - 12Combined272 Enrolled
Nazareth Catholic College - Primary Campus
1km
Findon 5023
CombinedNon-GovernmentP - 12Combined1784 Enrolled
SEDA College SA - Findon Campus
1.18km
Beverley 5009
SecondaryNon-GovernmentCombined Enrolled
Kidman Park Primary School
1.28km
Kidman Park 5025
PrimaryGovernmentP - 7Combined467 Enrolled
Flinders Park Primary School
1.48km
Flinders Park 5025
PrimaryGovernmentP - 7Combined314 Enrolled
Nazareth Catholic College - Secondary Campus
1.55km
Address not found
CombinedNon-GovernmentCombined Enrolled
Seaton Park Primary School
1.6km
Seaton 5023
PrimaryGovernmentP - 7Combined109 Enrolled
St Michael's College - Primary Campus
1.6km
Beverley 5009
CombinedNon-GovernmentCombined Enrolled
Allenby Gardens Primary School
1.88km
Allenby Gardens 5009
PrimaryGovernmentP - 7Combined517 Enrolled

Suburb Insights for Findon 5023

Market Insights
Findon Trends for Houses
Median Value

$946k

10.58%
View Trend
Median Growth

13.30%

View Trend
Median Rent

$620/W

6.90%
View Trend
Rental Yield

3.64%

5.45%
View Trend
Median Value: The middle value of all properties across the geography based on the Automated Valuation Model.


Median Value over 1 year (03/24 - 02/25)
Findon Trends for Units
Median Value

$589k

24.48%
View Trend
Median Growth

29.18%

View Trend
Median Rent

$517.5/W

6.15%
View Trend
Rental Yield

4.87%

9.14%
View Trend
Median Value: The middle value of all properties across the geography based on the Automated Valuation Model.


Median Value over 1 year (03/24 - 02/25)
Neighbourhood Insights
Age

Population 6,219

0-9


11%

10-19


11%

20-29


15%

30-39


15%

40-49


14%

50-59


12%

60-69


8%

70-79


8%

80-89


6%

90-99


2%

Household Structure
Occupancy
Disclaimer
Whilst all reasonable effort is made to ensure the information in this publication is current, CoreLogic does not warrant the accuracy or completeness of the data and information contained in this publication and to the full extent not prohibited by law excludes all liability for any loss or damage arising in connection with the data and information contained in this publication.
South Australia data
© 2025 Copyright in this information belongs to the South Australian Government and the South Australian Government does not accept any responsibility for the accuracy or completeness of the information or its suitability for purpose.
Valuations and Estimates
This estimate is provided by CoreLogic, and is based on statistical market data such as recent local sales, property size, number of bedrooms and many more factors. It comes from public data, which may be incomplete or inaccurate, and should not be used in lieu of a professional appraisal under any circumstances, including for lending purposes or in home loan applications.
School data and Content
Product Data licenced by CoreLogic under a Creative Commons Attribution licence. For details regarding licence, data source, copyright and disclaimers, see https://www.corelogic.com.au/legals/third-party-restrictions
ABS data
This publication contains data and statistics provided by the Australian Bureau of Statistics, available at http://www.abs.gov.au/ and reproduced under Creative Commons Attribution 2.5 http://creativecommons.org/licenses/by/2.5/au/legalcode
Liveability information
The Liveability Score is a rating (out of 10) provided by Propella.ai Pty Ltd as a guide about how "well-connected" properties are in certain local areas. The Liveability Score is based on statistical data about a local area in which a property is located including the distance to and number of available facilities and services (including schools, parklands, health services, shopping and public transport) (Liveability Data). The Liveability Data and Liveability Score has not been verified or confirmed by CoreLogic, is not available for all properties, and is of a general nature and should not be construed as specific advice or relied upon in lieu of appropriate professional advice. Given the relative nature of the Liveability Score, propella.ai anticipate that scores for individual properties will change over time.