15 Cattermull StreetSvensson Heights QLD 4670

Thinking about insurance?
Get estimated rebuild costs for this property with Sum SureProperty Details for 15 Cattermull St, Svensson Heights
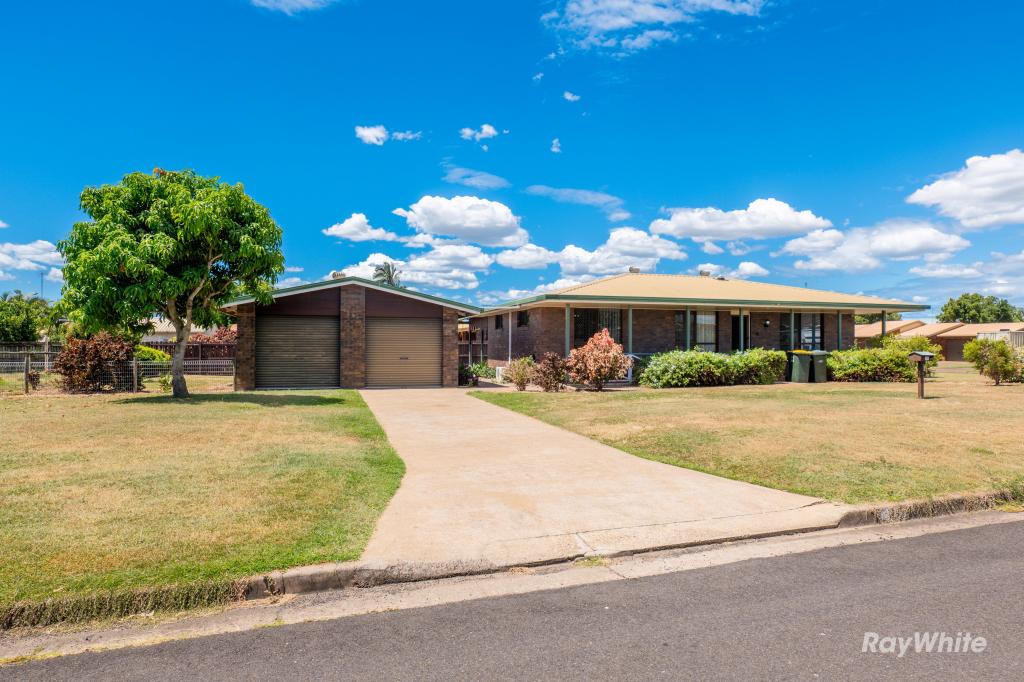
15 Cattermull St, Svensson Heights is a 3 bedroom, 1 bathroom House with 2 parking spaces and was built in 1940. The property has a land size of 739m2 and floor size of 119m2. While the property is not currently for sale or for rent, it was last sold in October 2022.
Last Listing description (December 2022)
Featuring a welcoming separate entry area that leads to a large central lounge that flows beautifully to the designated dining room and onto the modern style well-appointed kitchen which overlooks the backyard.
Add to this, three very good size bedrooms, all serviced by an attractive conveniently positioned bathroom, plus a second separate toilet, dual covered outdoor entertaining areas, and a covered carport attached to the house plus an extra-large separate car garage that has plenty of additional storage space included in the rear of the shed that is sure cover all of your storage needs.
If you are interested in this property, we kindly request that you submit your application online through https://snug.com/apply/raywhitebundaberg .
All applicants wanting to reside in the premises need to fill out individual applications.
Due to the current COVID-19 we have changed the ways in which you can apply for our available properties and no open homes will be conducted.
Please click on the APPLY NOW button on the property listing that you are interested in on our website at https://raywhitebundaberg.com.au/.
Please complete the online application, ensure all information has been provided and relevant documents uploaded. We will then process your application.
Only if your application has passed the relevant checks will a team member contact you to arrange a personal viewing.
Thank you for your understanding and patience at this time.
Property History for 15 Cattermull St, Svensson Heights, QLD 4670
- 12 Dec 2022Listed for Rent - Price not available
- 20 Oct 2022Sold for $385,000
- 17 Oct 2022Listed for Sale Offers Above $365,000
Recent sales nearby
See more recent sales nearbySimilar properties For Sale nearby
See more properties for sale nearby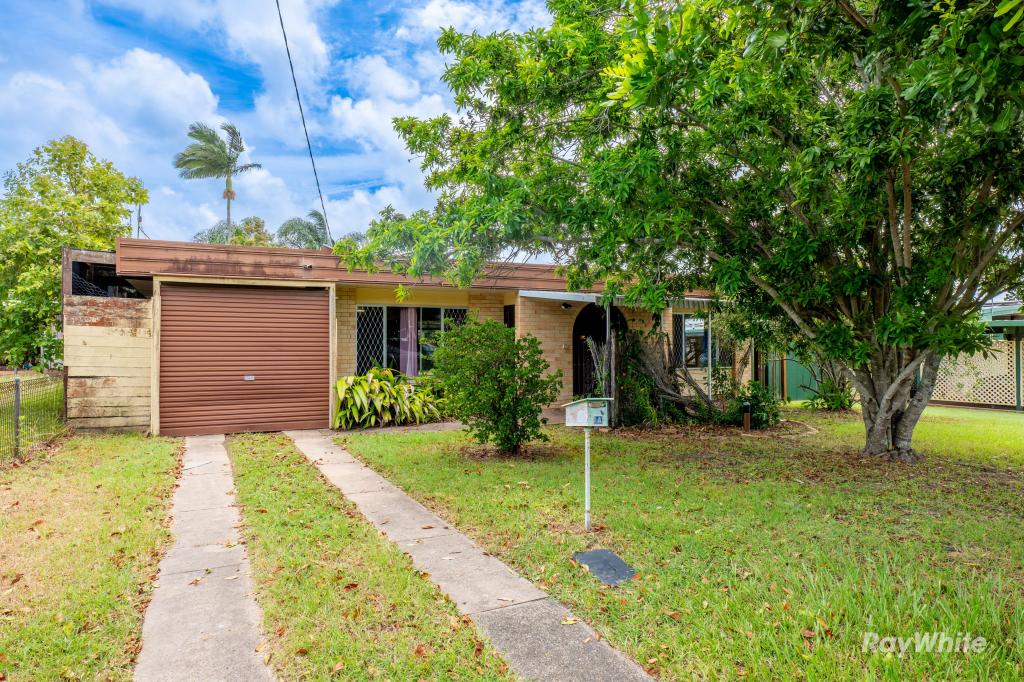


Similar properties For Rent nearby
See more properties for rent nearby
About Svensson Heights 4670
The size of Svensson Heights is approximately 2.9 square kilometres. It has 4 parks covering nearly 2.1% of total area. The population of Svensson Heights in 2011 was 3,204 people. By 2016 the population was 3,218 showing a population growth of 0.4% in the area during that time. The predominant age group in Svensson Heights is 50-59 years. Households in Svensson Heights are primarily childless couples and are likely to be repaying $1000 - $1399 per month on mortgage repayments. In general, people in Svensson Heights work in a professional occupation. In 2011, 60.6% of the homes in Svensson Heights were owner-occupied compared with 57.7% in 2016.
Svensson Heights has 1,725 properties. Over the last 5 years, Houses in Svensson Heights have seen a 128.68% increase in median value, while Units have seen a 95.58% increase. As at 28 February 2025:
- The median value for Houses in Svensson Heights is $489,728 while the median value for Units is $419,881.
- Houses have a median rent of $500 while Units have a median rent of $420.
What's around 15 Cattermull St, Svensson Heights
15 Cattermull St, Svensson Heights is in the school catchment zone for Bundaberg West State School and Bundaberg State High School.


Suburb Insights for Svensson Heights 4670
Market Insights
Svensson Heights Trends for Houses
$490k
15.87%
View Trend$500/W
5.92%
Svensson Heights Trends for Units
$420k
23.19%
View Trend$420/W
5.01%
Neighbourhood Insights
Age
Population 3,218
0-9
11%
10-19
11%
20-29
12%
30-39
10%
40-49
11%
50-59
13%
60-69
11%
70-79
12%
80-89
7%
90-99
2%
Household Structure
Occupancy
© Copyright 2025 RP Data Pty Ltd trading as CoreLogic Asia Pacific (CoreLogic). All rights reserved.
This product uses cookies and other similar technologies to improve and customise your browsing experience, to tailor content and adverts, and for analytics and metrics regarding visitor usage on this product and other media. We may share cookie and analytics information with third parties for the purposes of advertising. By continuing to use our website, you consent to cookies being used. View our Privacy Policy here.
X