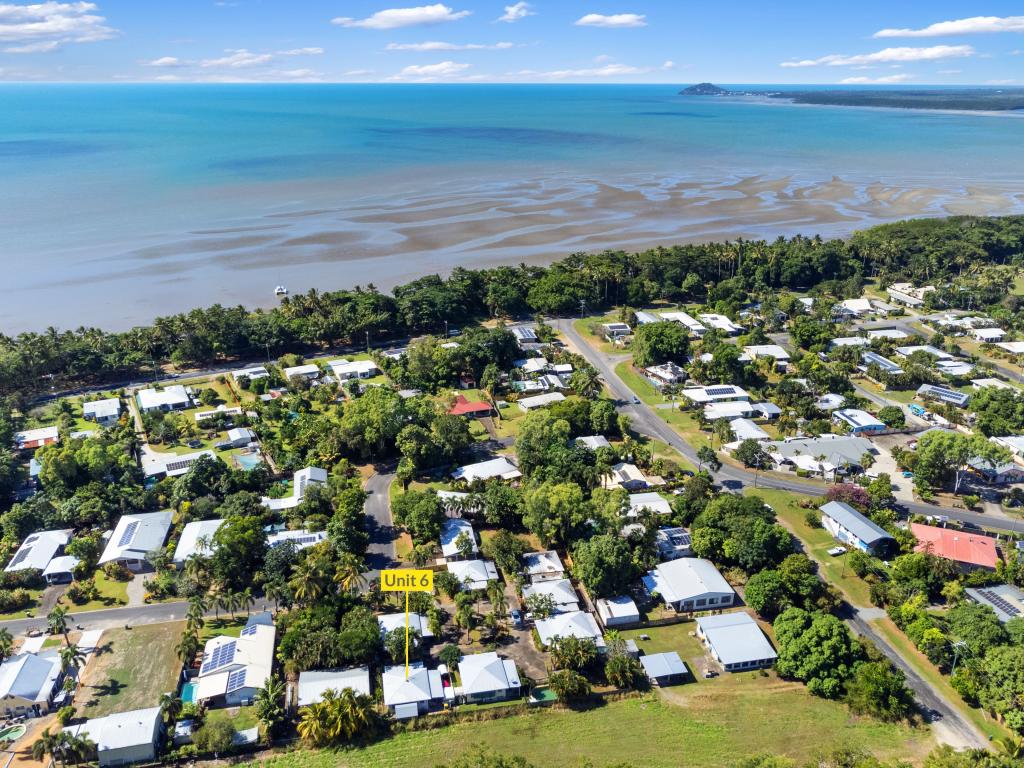
11 Marine ParadeNewell QLD 4873
Property Details for 11 Marine Pde, Newell
11 Marine Pde, Newell is a 2 bedroom, 1 bathroom Unit with 1 parking spaces and was built in 1990. The property has a land size of 421m2 and floor size of 69m2.
Last Listing description (March 2024)
This upstairs, furnished, 2 bedroom unit is situated in a complex of 5 units that are beach front on Newell Beach, so you can walk out of the complex and straight onto the beach for that morning power walk or evening stroll. Location is everything here! The complex has its own swimming pool with a view of the beach, and a view of the mountain range from the front balcony of the unit. The unit also features air conditioning, ceiling fans, security screens, window coverings, front & side balcony areas, electric cooking, internal laundry area, built-in wardrobes and linen cupboard. Please contact our office on (07) 4098 3111 to apply or for list of inventory items.
Property History for 11 Marine Pde, Newell, QLD 4873
- 21 Nov 2023Listed for Rent $440 / week
- 05 Dec 2022Listed for Rent $390 / week
- 18 May 2022Listed for Rent $350 / week
Commute Calculator
Recent sales nearby
See more recent sales nearby 0
0
 0
0Similar properties For Sale nearby
See more properties for sale nearby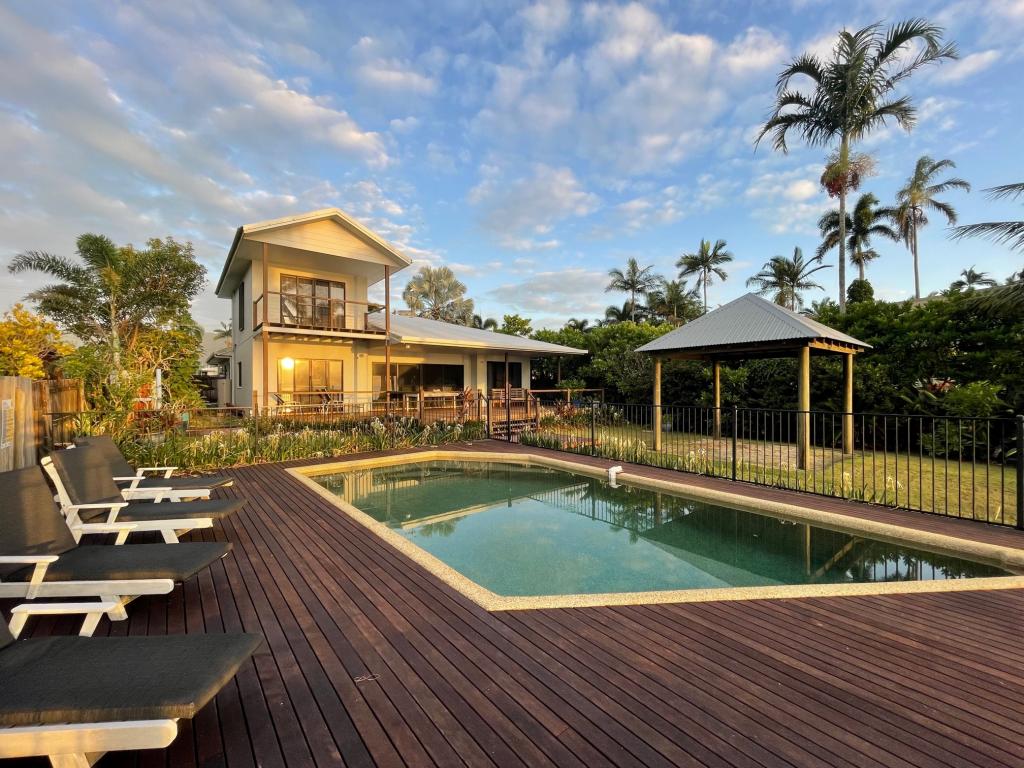 0
0
 0
0 0
0
Similar properties For Rent nearby
See more properties for rent nearby 0
0 0
0 0
0About Newell 4873
The size of Newell is approximately 7.3 square kilometres. It has 5 parks covering nearly 14.2% of total area. The population of Newell in 2011 was 326 people. By 2016 the population was 328 showing a population growth of 0.6% in the area during that time. The predominant age group in Newell is 50-59 years. Households in Newell are primarily childless couples and are likely to be repaying $1400 - $1799 per month on mortgage repayments. In general, people in Newell work in a trades occupation. In 2011, 66.9% of the homes in Newell were owner-occupied compared with 69% in 2016.
Newell has 238 properties. Over the last 5 years, Houses in Newell have seen a 65.07% increase in median value, while Units have seen a -3.35% decrease. As at 31 October 2024:
- The median value for Houses in Newell is $552,252 while the median value for Units is $377,221.
- Houses have a median rent of $390.
Suburb Insights for Newell 4873
Market Insights
Newell Trends for Houses
N/A
N/A
View TrendN/A
N/A
Newell Trends for Units
N/A
N/A
View TrendN/A
N/A
Neighbourhood Insights
© Copyright 2024 RP Data Pty Ltd trading as CoreLogic Asia Pacific (CoreLogic). All rights reserved.
This product uses cookies and other similar technologies to improve and customise your browsing experience, to tailor content and adverts, and for analytics and metrics regarding visitor usage on this product and other media. We may share cookie and analytics information with third parties for the purposes of advertising. By continuing to use our website, you consent to cookies being used. View our Privacy Policy here.
X