6 Leslie StreetKallangur QLD 4503
Property Details for 6 Leslie St, Kallangur
6 Leslie St, Kallangur is a 3 bedroom, 1 bathroom House with 2 parking spaces and was built in 1970. The property has a land size of 681m2 and floor size of 84m2. While the property is not currently for sale or for rent, it was last transferred in August 2020.
Property History for 6 Leslie St, Kallangur, QLD 4503
- 08 Oct 2020Listed for Rent $385 / week
- 06 Aug 2020Transferred for $355,000
- 07 Jul 2020Listed for Sale Auction
Commute Calculator
Recent sales nearby
See more recent sales nearby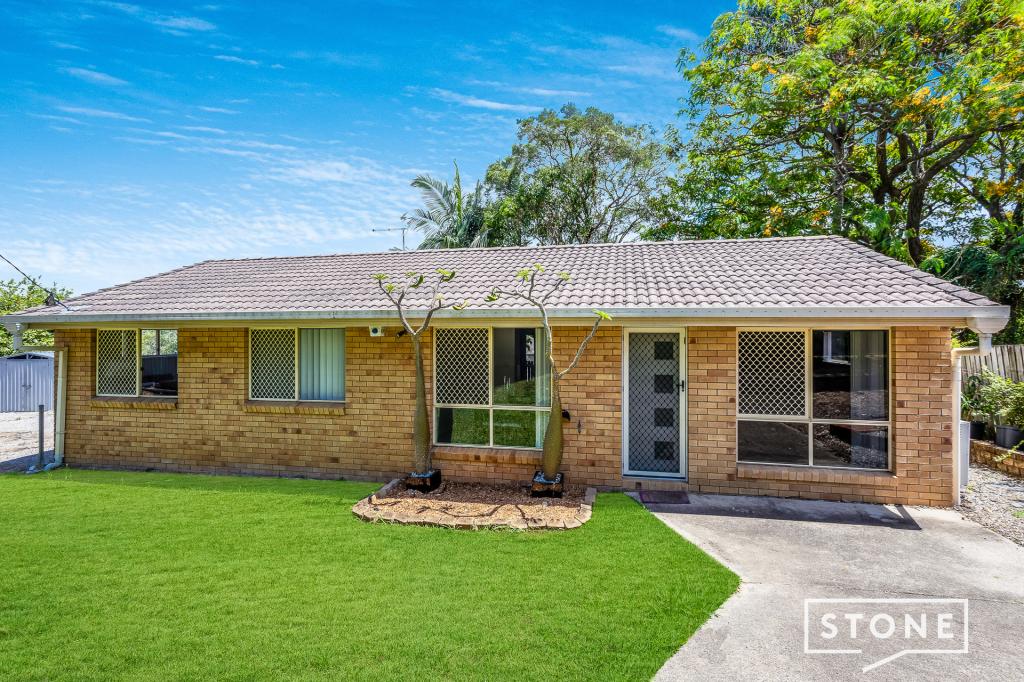 0
0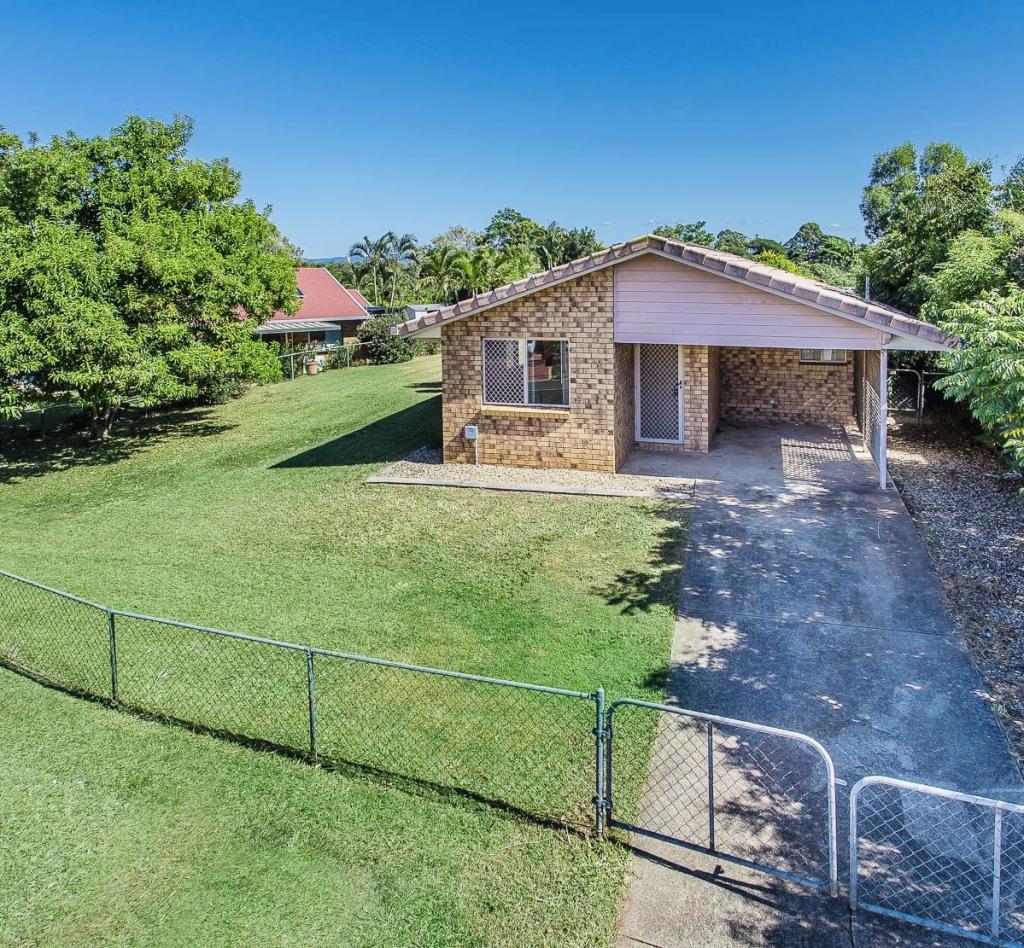 0
0Similar properties For Sale nearby
See more properties for sale nearby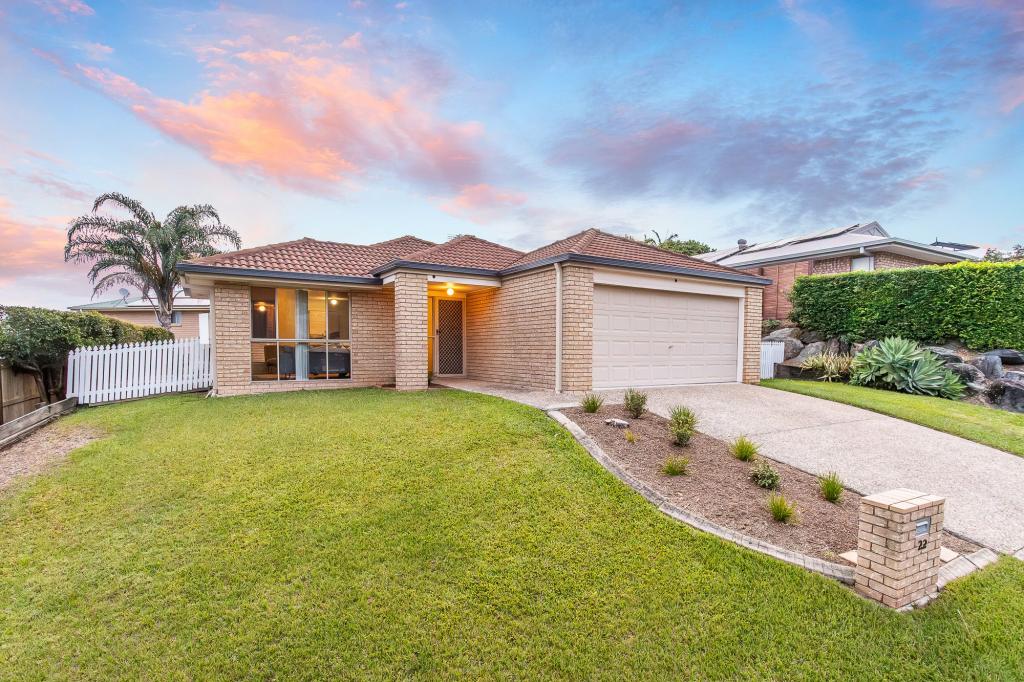 0
0
 0
0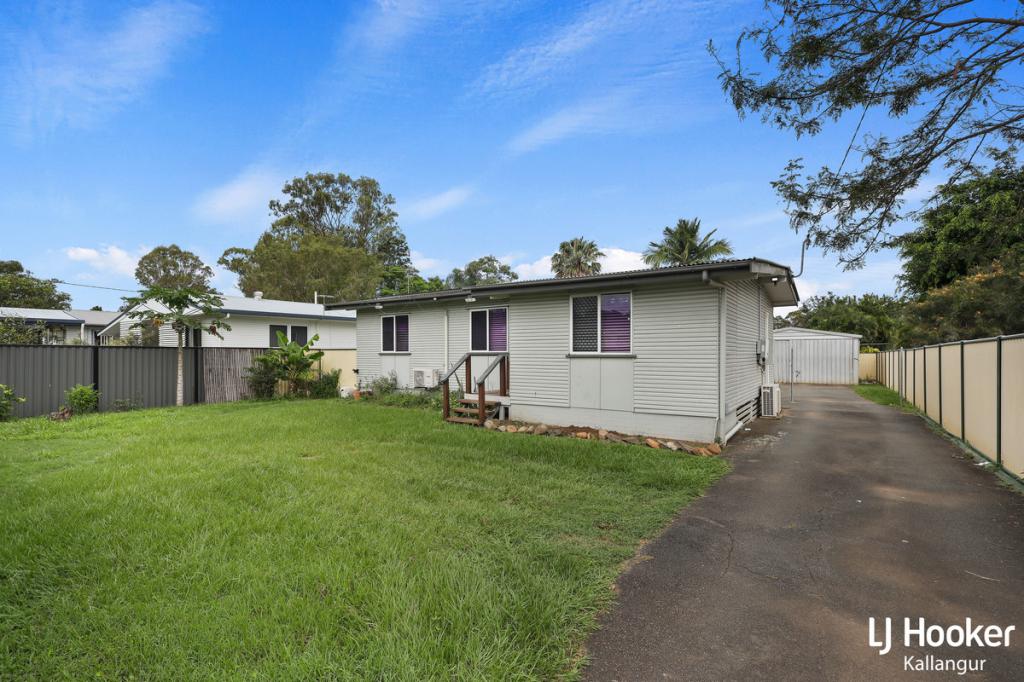 0
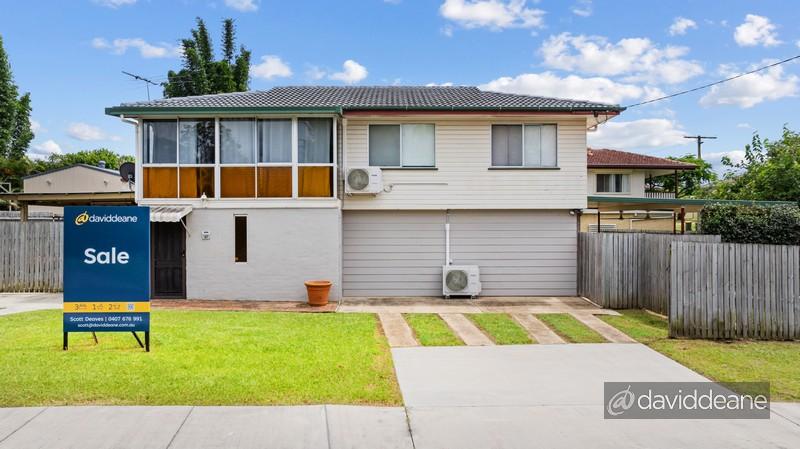
0Similar properties For Rent nearby
See more properties for rent nearby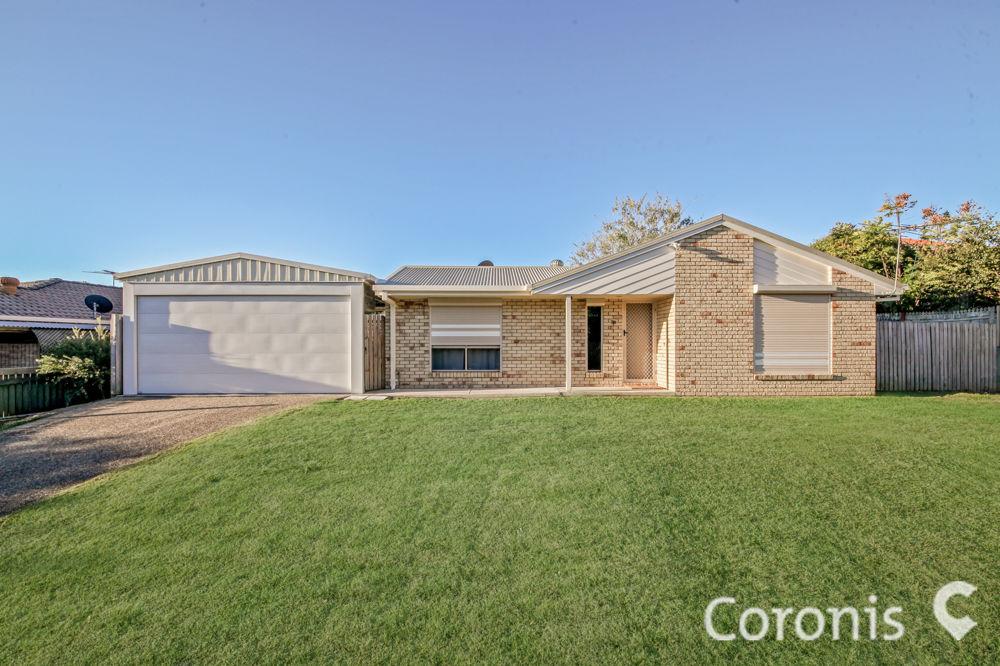 0
0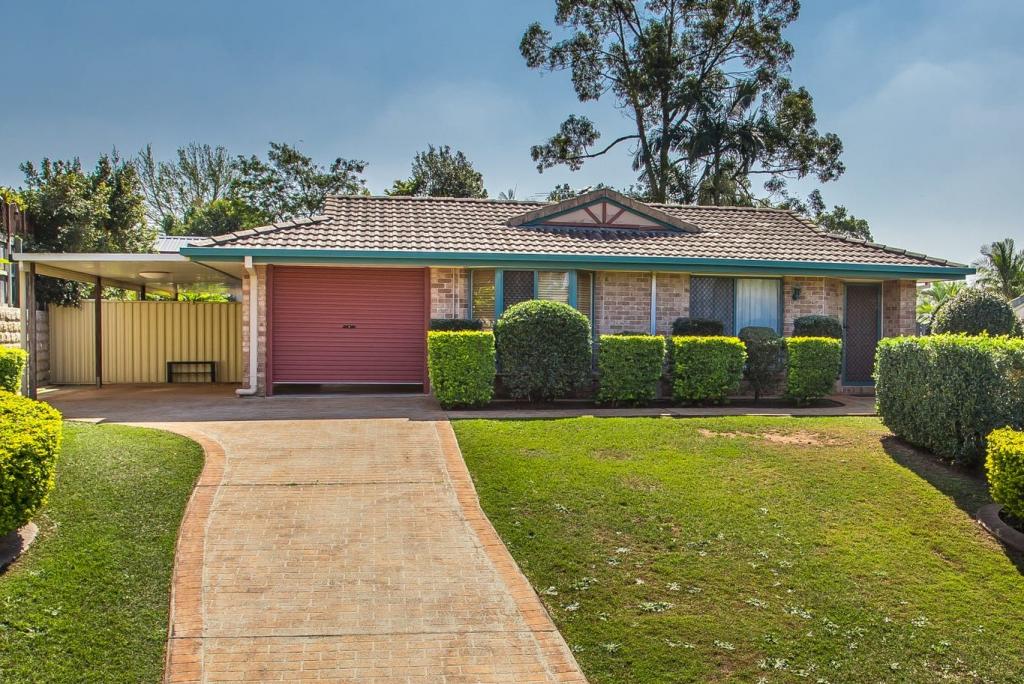 0
0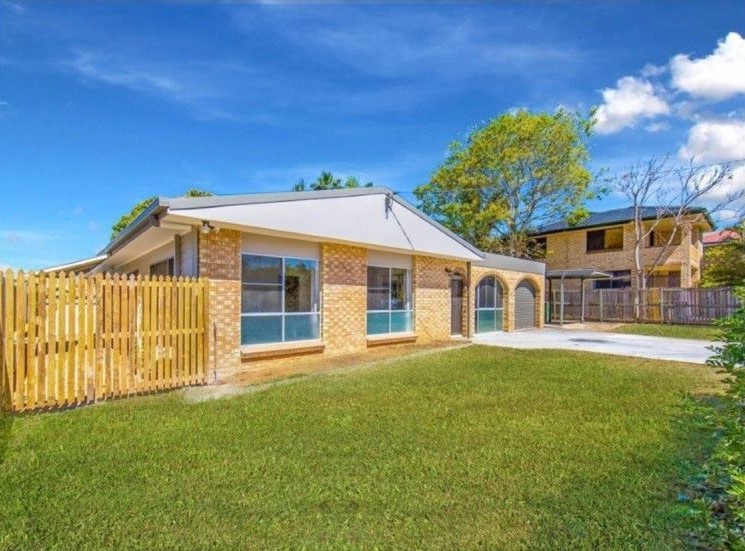 0
0
About Kallangur 4503
The size of Kallangur is approximately 11.3 square kilometres. It has 64 parks covering nearly 11% of total area. The population of Kallangur in 2011 was 18,982 people. By 2016 the population was 20,409 showing a population growth of 7.5% in the area during that time. The predominant age group in Kallangur is 0-9 years. Households in Kallangur are primarily couples with children and are likely to be repaying $1400 - $1799 per month on mortgage repayments. In general, people in Kallangur work in a trades occupation. In 2011, 62.7% of the homes in Kallangur were owner-occupied compared with 58.3% in 2016.
Kallangur has 9,678 properties. Over the last 5 years, Houses in Kallangur have seen a 87.00% increase in median value, while Units have seen a 90.40% increase. As at 30 November 2024:
- The median value for Houses in Kallangur is $744,668 while the median value for Units is $562,422.
- Houses have a median rent of $550 while Units have a median rent of $480.
Suburb Insights for Kallangur 4503
Market Insights
Kallangur Trends for Houses
N/A
N/A
View TrendN/A
N/A
Kallangur Trends for Units
N/A
N/A
View TrendN/A
N/A
Neighbourhood Insights
© Copyright 2025 RP Data Pty Ltd trading as CoreLogic Asia Pacific (CoreLogic). All rights reserved.
This product uses cookies and other similar technologies to improve and customise your browsing experience, to tailor content and adverts, and for analytics and metrics regarding visitor usage on this product and other media. We may share cookie and analytics information with third parties for the purposes of advertising. By continuing to use our website, you consent to cookies being used. View our Privacy Policy here.
X