23 Lower Hickey StreetEast Innisfail QLD 4860
Property Details for 23 Lower Hickey St, East Innisfail
23 Lower Hickey St, East Innisfail is a 4 bedroom, 1 bathroom House with 2 parking spaces and was built in 1985. The property has a land size of 1012m2 and floor size of 157m2. While the property is not currently for sale or for rent, it was last sold in June 2021.
Last Listing description (August 2021)
Newly renovated, this 4 bedroom home in a no through road features...
Fully tiled floor coverings, air conditioning in 3 bedrooms and living area. Built in cupboards in 3 bedrooms. This home also has some security screens, large car accommodation and is all on 1012 square metres of land.
* Spacious open plan living area
* Air Cond. in 3 b'rms and lounge
* Built-in cupboards in 3 b'rms
* Large garden shed
Contact John Strano for an inspection.
Property History for 23 Lower Hickey St, East Innisfail, QLD 4860
- 26 Jun 2021Sold for $250,000
- 15 Jul 2020Listed for Sale $265,000 Negotiable
- 01 Oct 2016Sold for $120,000
Commute Calculator
Recent sales nearby
See more recent sales nearbySimilar properties For Sale nearby
See more properties for sale nearby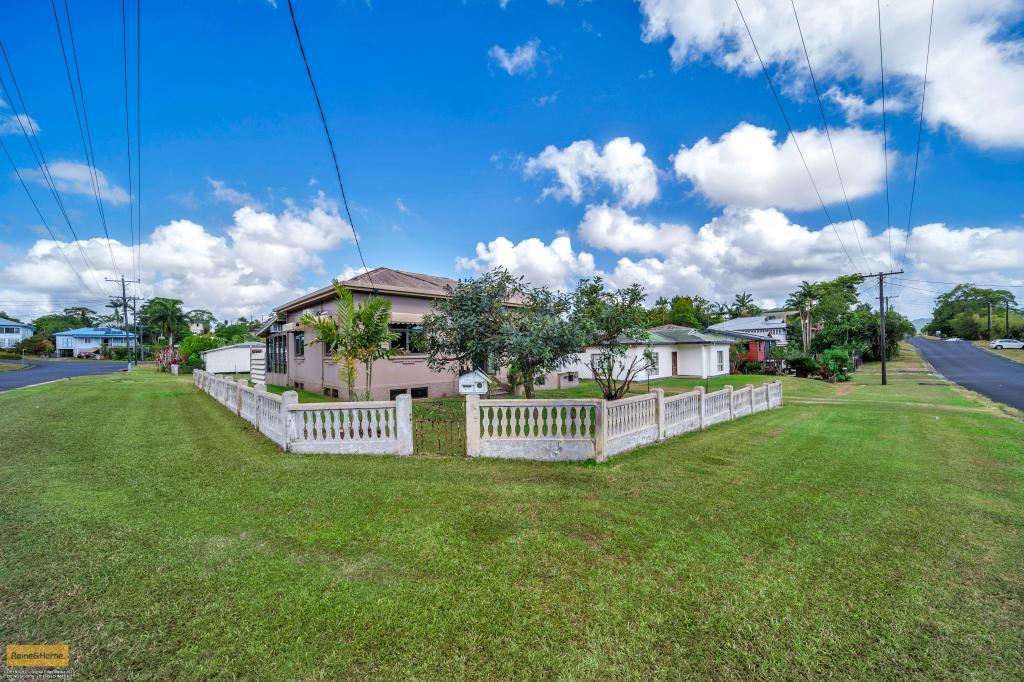 0
0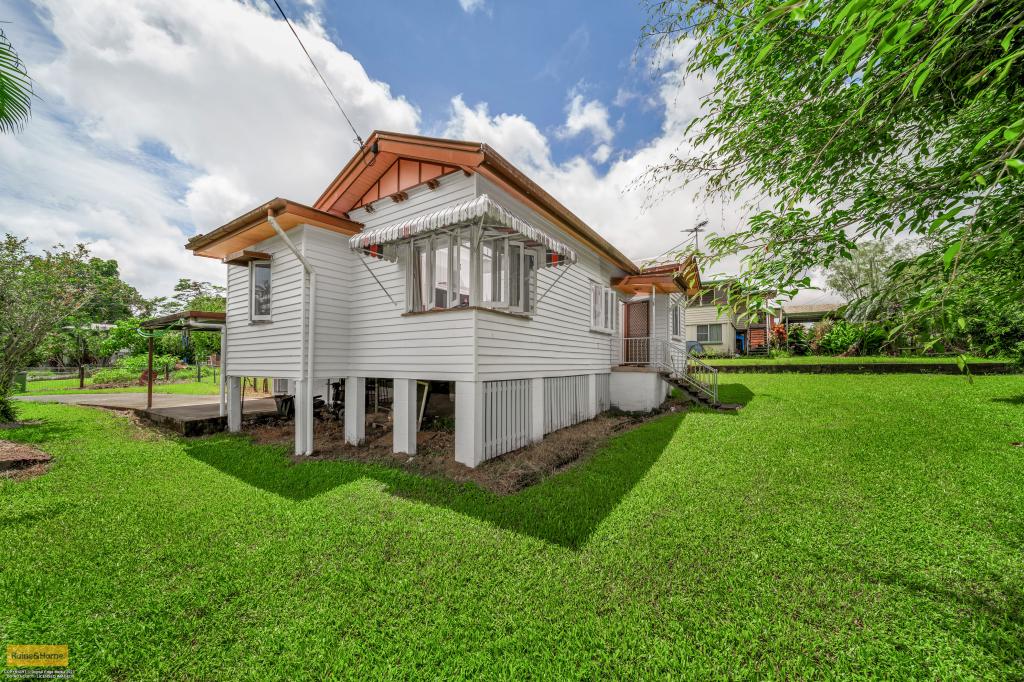 0
0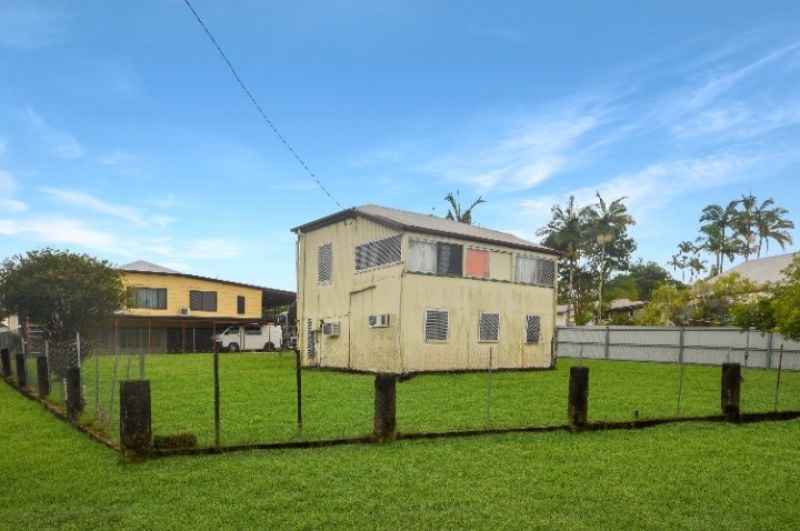 0
0Similar properties For Rent nearby
See more properties for rent nearby 0
0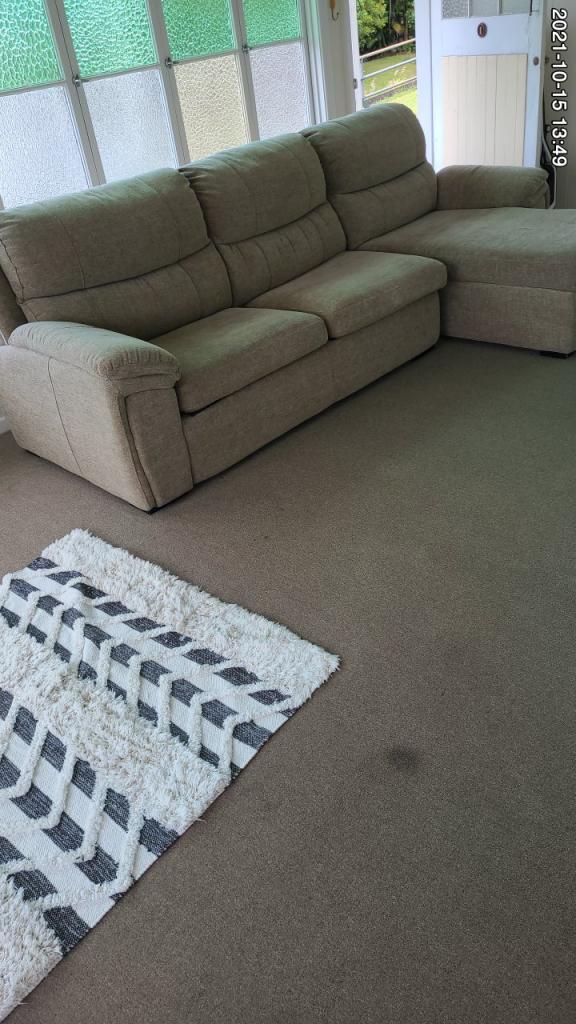 0
0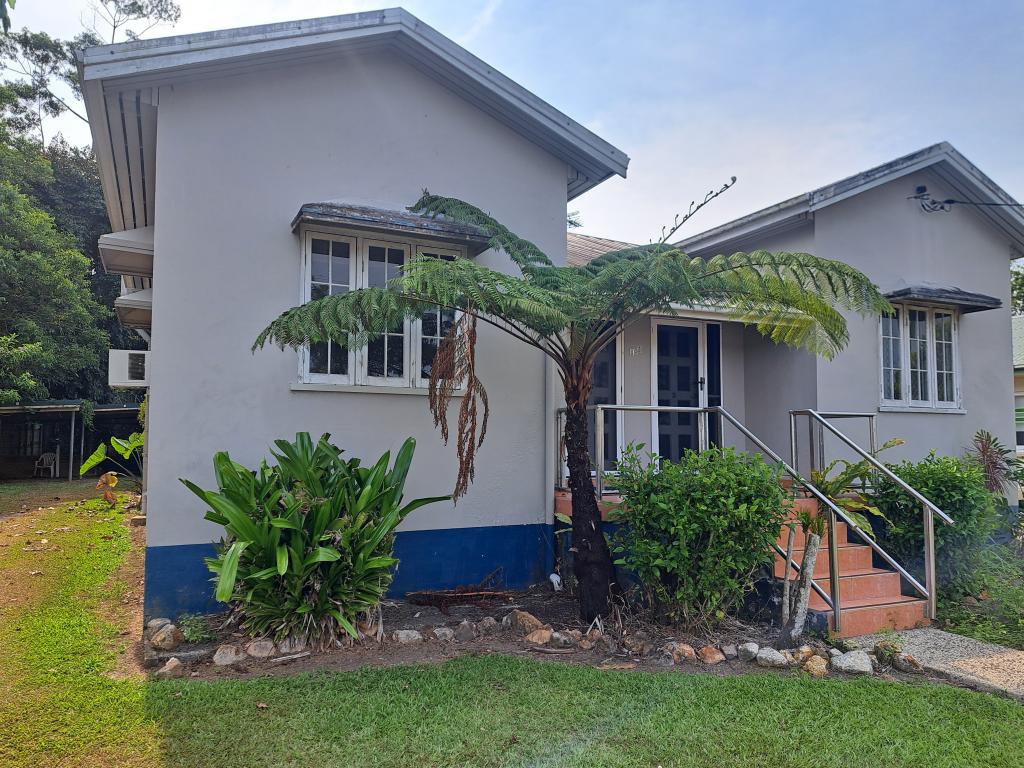 0
0About East Innisfail 4860
The size of East Innisfail is approximately 1.4 square kilometres. It has 4 parks covering nearly 8.6% of total area. The population of East Innisfail in 2011 was 1,827 people. By 2016 the population was 1,841 showing a population growth of 0.8% in the area during that time. The predominant age group in East Innisfail is 10-19 years. Households in East Innisfail are primarily childless couples and are likely to be repaying $1000 - $1399 per month on mortgage repayments. In general, people in East Innisfail work in a labourer occupation. In 2011, 57.6% of the homes in East Innisfail were owner-occupied compared with 56.5% in 2016.
East Innisfail has 912 properties. Over the last 5 years, Houses in East Innisfail have seen a 69.32% increase in median value, while Units have seen a 49.87% increase. As at 30 November 2024:
- The median value for Houses in East Innisfail is $317,085 while the median value for Units is $314,019.
- Houses have a median rent of $420 while Units have a median rent of $290.
Suburb Insights for East Innisfail 4860
Market Insights
East Innisfail Trends for Houses
N/A
N/A
View TrendN/A
N/A
East Innisfail Trends for Units
N/A
N/A
View TrendN/A
N/A
Neighbourhood Insights
© Copyright 2024 RP Data Pty Ltd trading as CoreLogic Asia Pacific (CoreLogic). All rights reserved.
This product uses cookies and other similar technologies to improve and customise your browsing experience, to tailor content and adverts, and for analytics and metrics regarding visitor usage on this product and other media. We may share cookie and analytics information with third parties for the purposes of advertising. By continuing to use our website, you consent to cookies being used. View our Privacy Policy here.
X