12 Macrossan StreetCranley QLD 4350
Property Details for 12 Macrossan St, Cranley
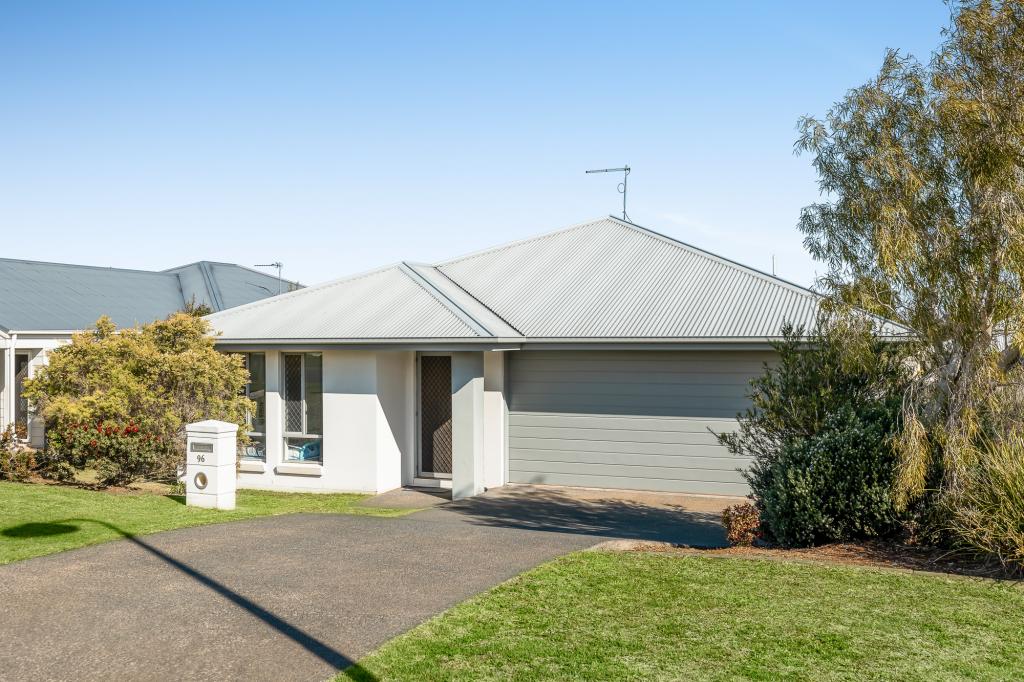
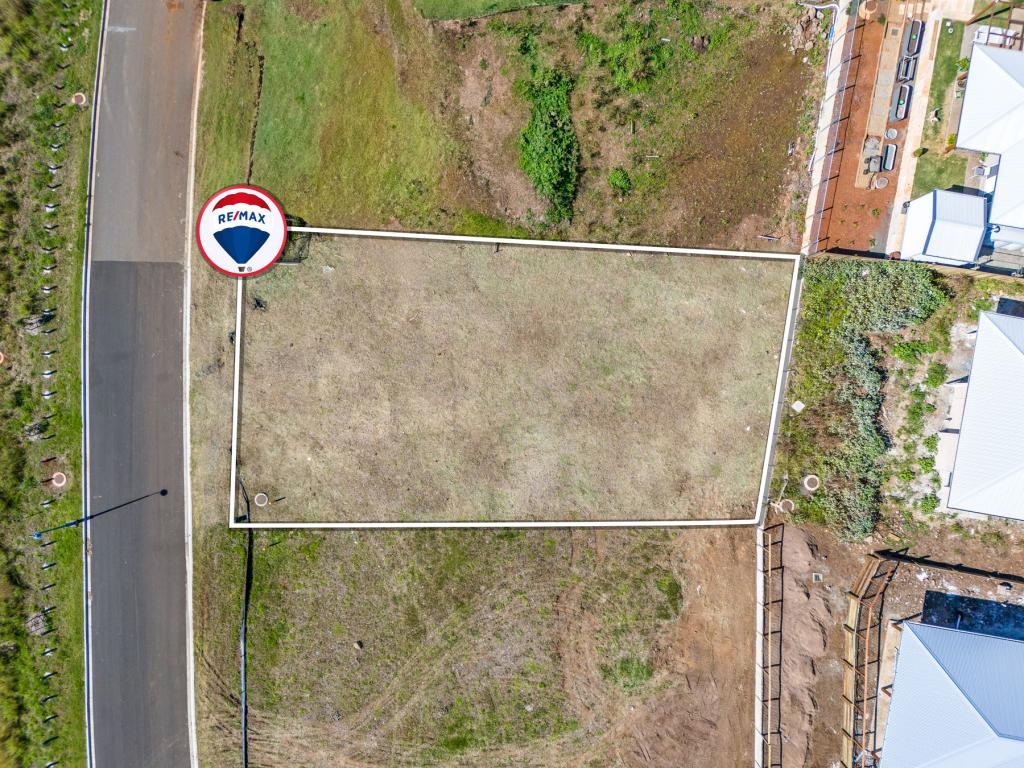
12 Macrossan St, Cranley is a 4 bedroom, 2 bathroom House with 2 parking spaces and was built in 2003. The property has a land size of 600m2 and floor size of 174m2. While the property is not currently for sale or for rent, it was last sold in February 2017.
Last Listing description (May 2017)
A comfortable home in a quiet street with good living spaces and good sized bedrooms. Big pergola area and a secure yard.
- 4 bedrooms. Ensuite and WIR to main bedroom
- Great kitchen with dishwasher
- Separate lounge/media room
- Bathroom has spa bath
- Drive through garage
- Garden shed
Inspection by appointment. (Better photos to come).
Property History for 12 Macrossan St, Cranley, QLD 4350
- 05 Apr 2017Listed for Rent - Price not available
- 06 Feb 2017Sold for $329,000
- 21 Sep 2009Sold for $329,000
Commute Calculator
Recent sales nearby
See more recent sales nearby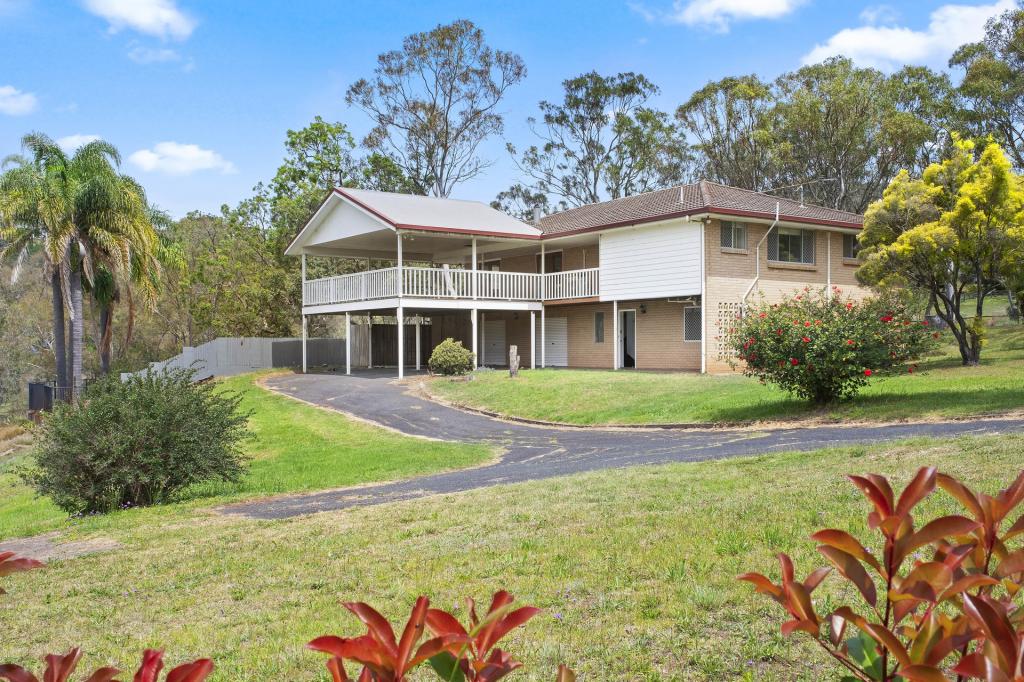 0
0
 0
0Similar properties For Sale nearby
See more properties for sale nearby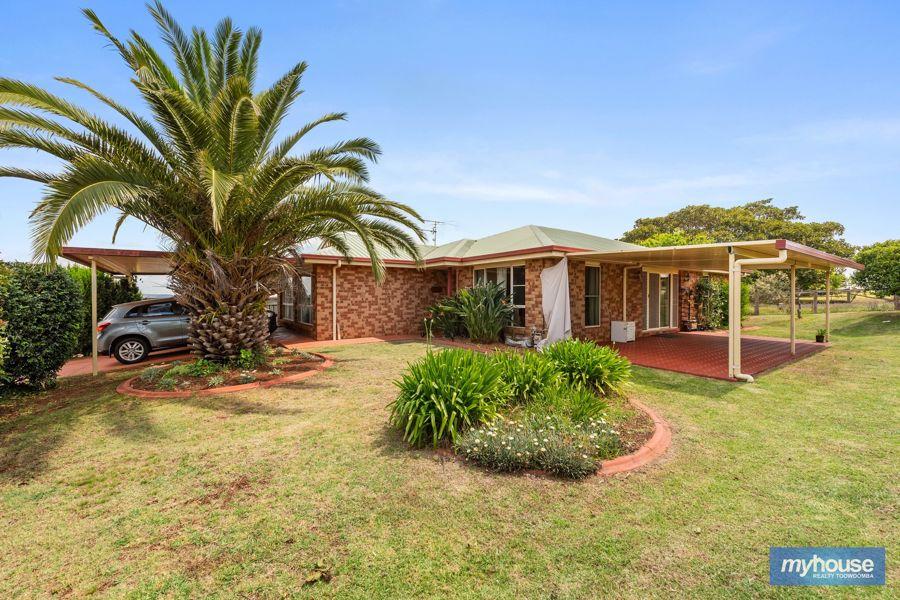 0
0 0
0
 0
0
Similar properties For Rent nearby
See more properties for rent nearby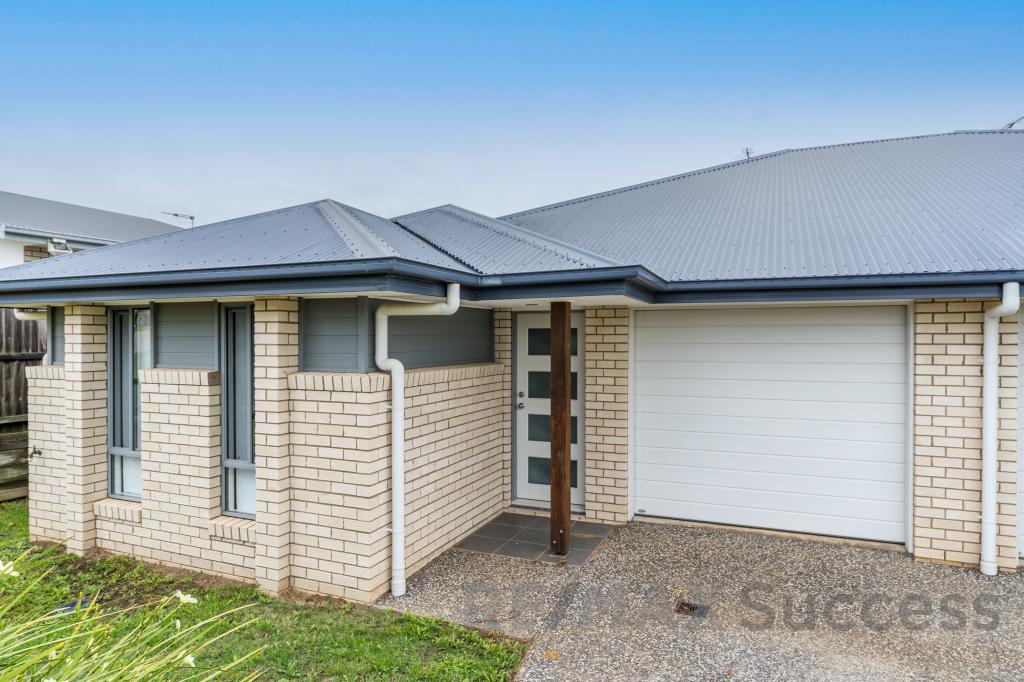 0
0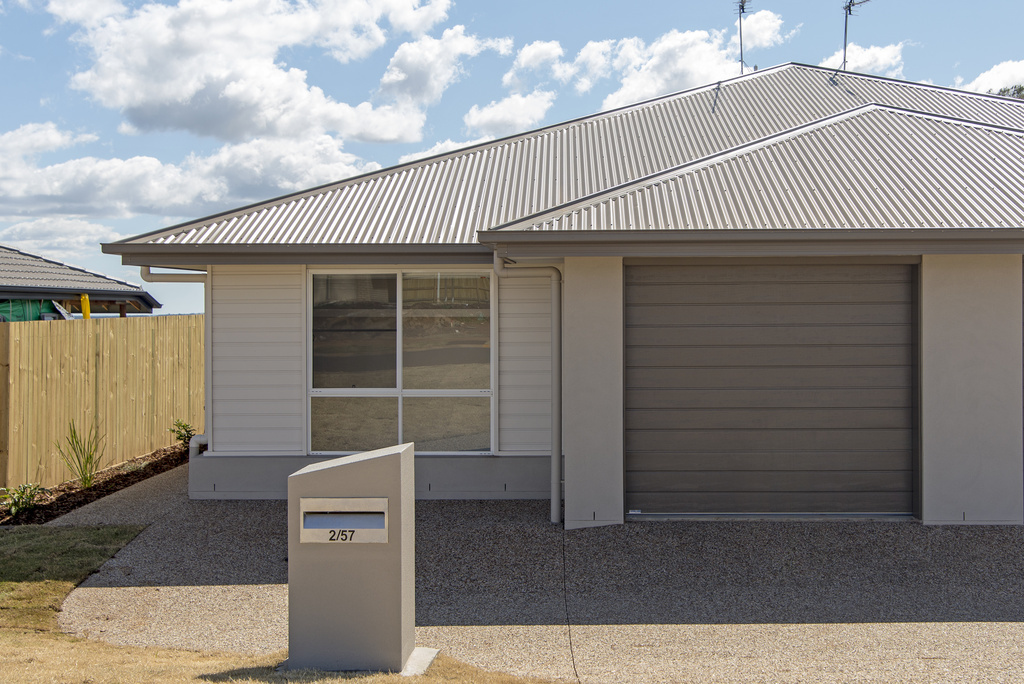 0
0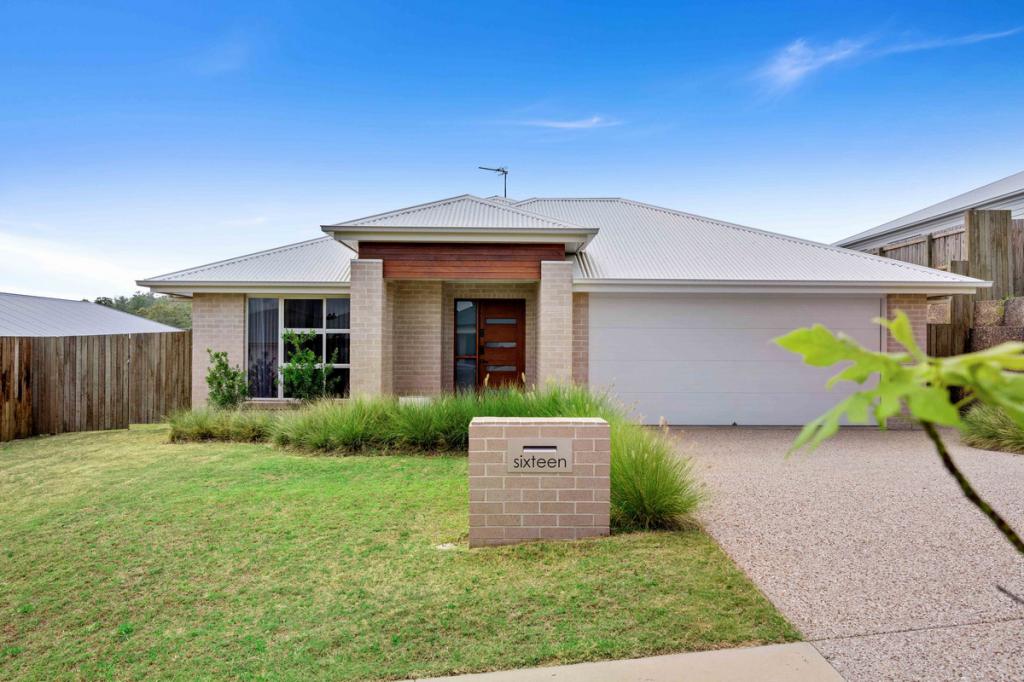 0
0About Cranley 4350
The size of Cranley is approximately 10.3 square kilometres. It has 3 parks covering nearly 0.1% of total area. The population of Cranley in 2011 was 851 people. By 2016 the population was 1,444 showing a population growth of 69.7% in the area during that time. The predominant age group in Cranley is 70-79 years. Households in Cranley are primarily childless couples and are likely to be repaying $1400 - $1799 per month on mortgage repayments. In general, people in Cranley work in a trades occupation. In 2011, 77.2% of the homes in Cranley were owner-occupied compared with 66.4% in 2016.
Cranley has 862 properties. Over the last 5 years, Houses in Cranley have seen a 84.52% increase in median value, while Units have seen a 93.81% increase. As at 31 October 2024:
- The median value for Houses in Cranley is $643,119 while the median value for Units is $520,101.
- Houses have a median rent of $550 while Units have a median rent of $450.
Suburb Insights for Cranley 4350
Market Insights
Cranley Trends for Houses
N/A
N/A
View TrendN/A
N/A
Cranley Trends for Units
N/A
N/A
View TrendN/A
N/A
Neighbourhood Insights
© Copyright 2024 RP Data Pty Ltd trading as CoreLogic Asia Pacific (CoreLogic). All rights reserved.
This product uses cookies and other similar technologies to improve and customise your browsing experience, to tailor content and adverts, and for analytics and metrics regarding visitor usage on this product and other media. We may share cookie and analytics information with third parties for the purposes of advertising. By continuing to use our website, you consent to cookies being used. View our Privacy Policy here.
X