5 Nangando StreetCapalaba QLD 4157
Property Details for 5 Nangando St, Capalaba
5 Nangando St, Capalaba is a 0 bedroom, 1 bathroom House with 4 parking spaces and was built in 1988. The property has a land size of 742m2 and floor size of 101m2. While the property is not currently for sale or for rent, it was last sold in January 2021.
Last Listing description (March 2021)
FACETIME WALKTHROUGH AVAILABLE - CONTACT AGENT
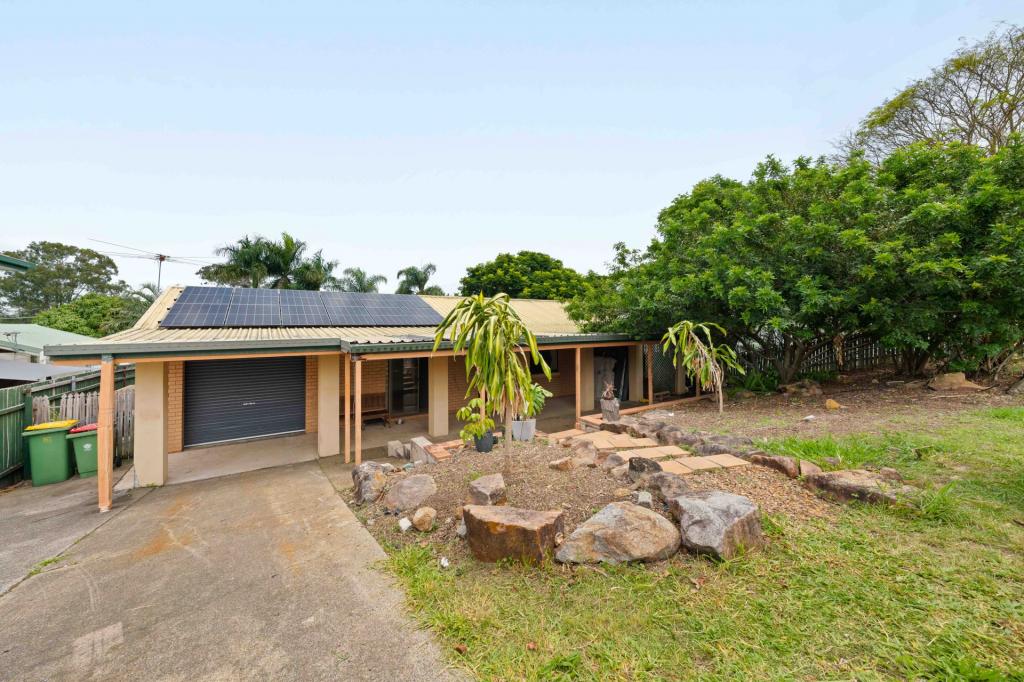
This fantastic Capalaba home is in a quiet cul de sac location, backing onto parkland and with tonnes of yard space. This home would be ideal for downsizers and first home buyers alike.
Features Include:
Family bathroom
Open plan living and dining area
Renovated kitchen
Large outdoor patio that adjoins living room and kitchen
Double Garage + double carport
Fully fenced yard
Manicured gardens
Walking distance to local shopping, schools, public transport and a park at your back door.
Inspect with SOLOMON SONER - TEAM SOLOMON ESTATE AGENTS
Property History for 5 Nangando St, Capalaba, QLD 4157
- 18 Jan 2021Sold for $530,000
- 07 Jan 2021Listed for Sale BY NEGOTIATION
- 30 Dec 1988Sold for $96,000
Commute Calculator
Recent sales nearby
See more recent sales nearby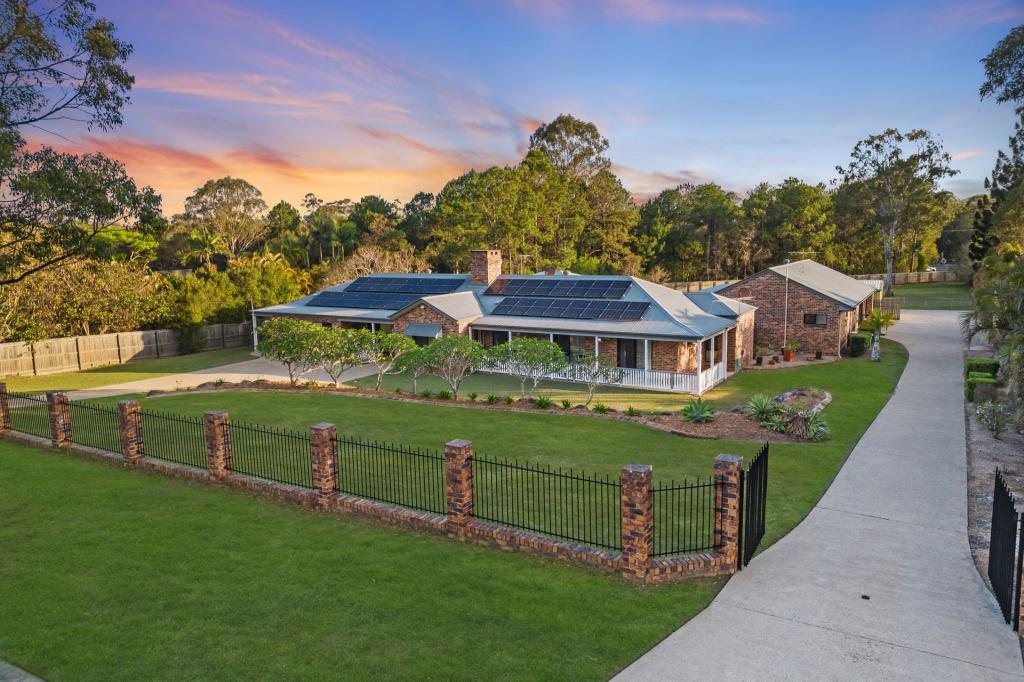 0
0Similar properties For Sale nearby
See more properties for sale nearby
 0
0 0
0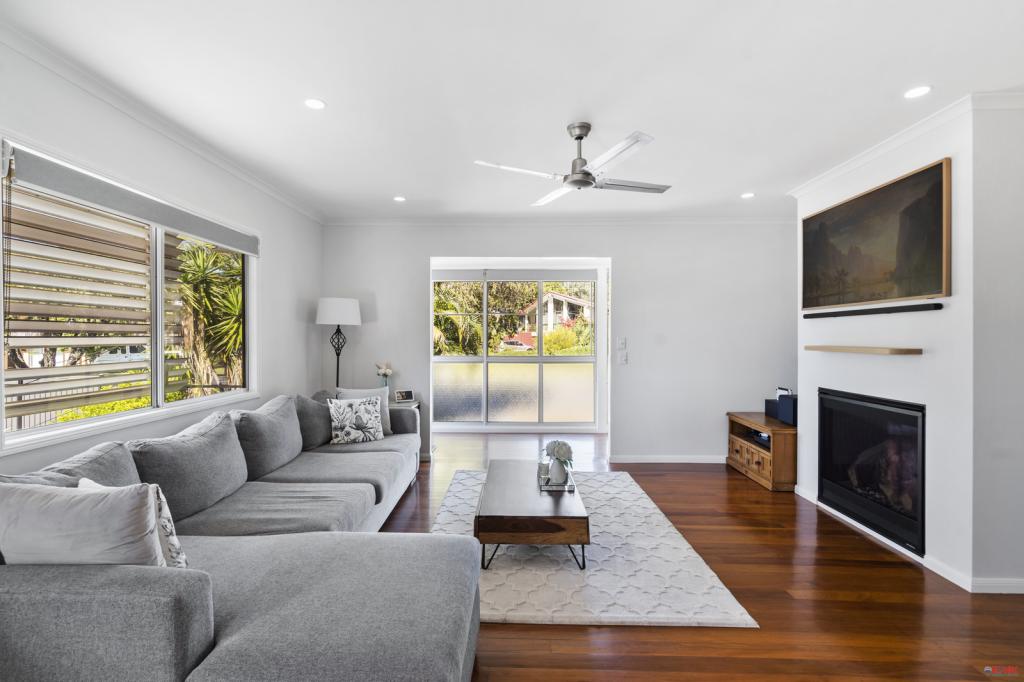 0
0Similar properties For Rent nearby
See more properties for rent nearby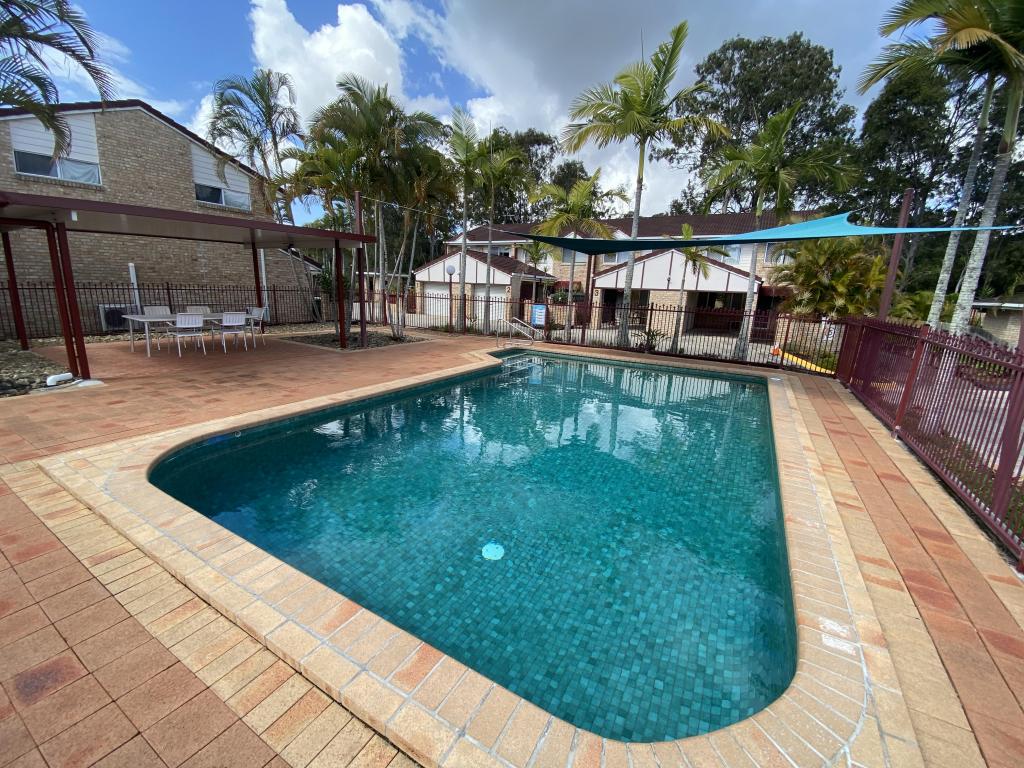 0
0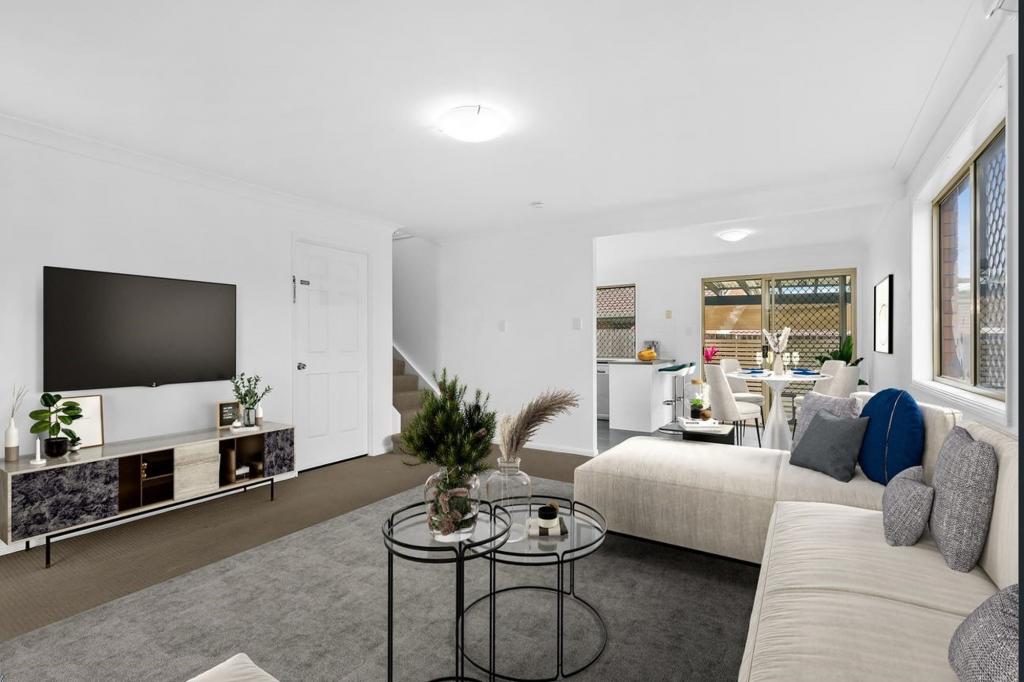 0
0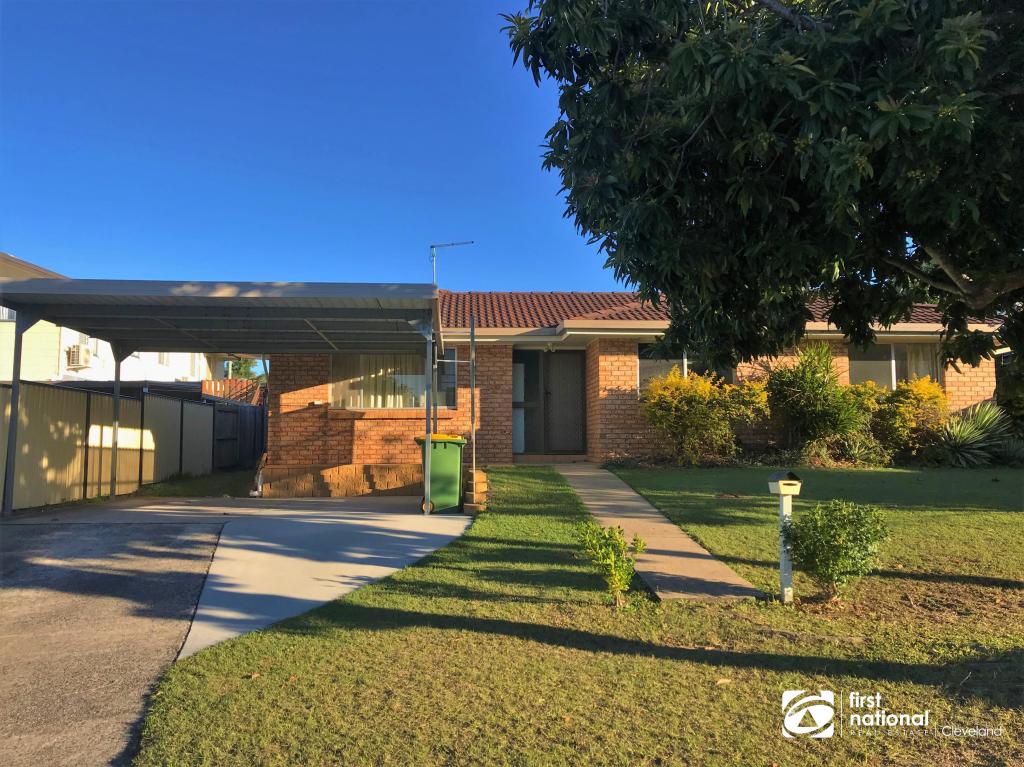 0
0About Capalaba 4157
The size of Capalaba is approximately 18.7 square kilometres. It has 42 parks covering nearly 11.2% of total area. The population of Capalaba in 2011 was 16,644 people. By 2016 the population was 17,365 showing a population growth of 4.3% in the area during that time. The predominant age group in Capalaba is 50-59 years. Households in Capalaba are primarily couples with children and are likely to be repaying $1800 - $2399 per month on mortgage repayments. In general, people in Capalaba work in a trades occupation. In 2011, 72.1% of the homes in Capalaba were owner-occupied compared with 71.4% in 2016.
Capalaba has 8,565 properties. Over the last 5 years, Houses in Capalaba have seen a 78.44% increase in median value, while Units have seen a 98.62% increase. As at 31 October 2024:
- The median value for Houses in Capalaba is $897,724 while the median value for Units is $607,921.
- Houses have a median rent of $650 while Units have a median rent of $560.
Suburb Insights for Capalaba 4157
Market Insights
Capalaba Trends for Houses
N/A
N/A
View TrendN/A
N/A
Capalaba Trends for Units
N/A
N/A
View TrendN/A
N/A
Neighbourhood Insights
© Copyright 2024 RP Data Pty Ltd trading as CoreLogic Asia Pacific (CoreLogic). All rights reserved.
This product uses cookies and other similar technologies to improve and customise your browsing experience, to tailor content and adverts, and for analytics and metrics regarding visitor usage on this product and other media. We may share cookie and analytics information with third parties for the purposes of advertising. By continuing to use our website, you consent to cookies being used. View our Privacy Policy here.
X