171 Redland Bay RoadCapalaba QLD 4157
Property Details for 171 Redland Bay Rd, Capalaba
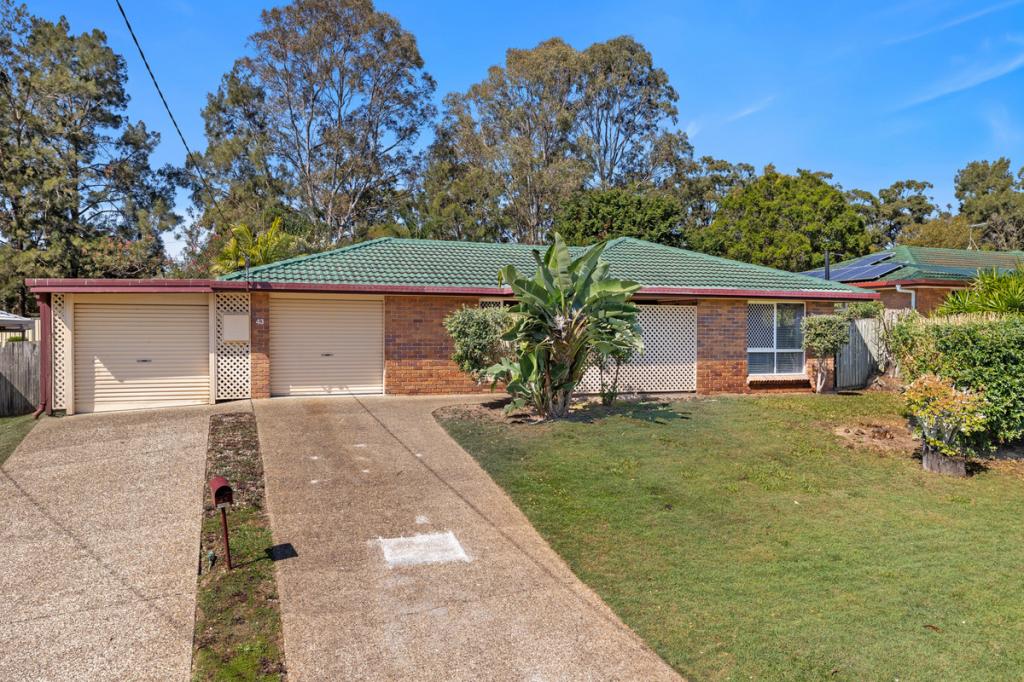
171 Redland Bay Rd, Capalaba is a 3 bedroom, 2 bathroom House with 1 parking spaces and was built in 1980. The property has a land size of 717m2 and floor size of 130m2. While the property is not currently for sale or for rent, it was last sold in August 2023.
Last Listing description (May 2014)
Sell Your Car - Walk to EVERYTHING
This immaculate low-set brick & tile is located very conveniently and has a lot to offer, featuring: * 4 good size bedrooms, 2 bathrooms * main with ensuite * air-conditioners * big outdoor under-cover area * fully fenced large yard for kids to play around * under-roof car-port & utility room - can be turned into lock-up garage * house extension approval in place * many fruit trees for you to save money on shopping * walk to Everything - schools, major shops, transport, etc. * GREAT LOCATION, GREAT POTENTIALS call marketing agent now to inspect
Property History for 171 Redland Bay Rd, Capalaba, QLD 4157
- 14 Aug 2023Sold for $720,000
- 17 Aug 2014Sold for $443,000
- 10 Apr 2014Listed for Sale OFFERS OVER $450,000
Commute Calculator
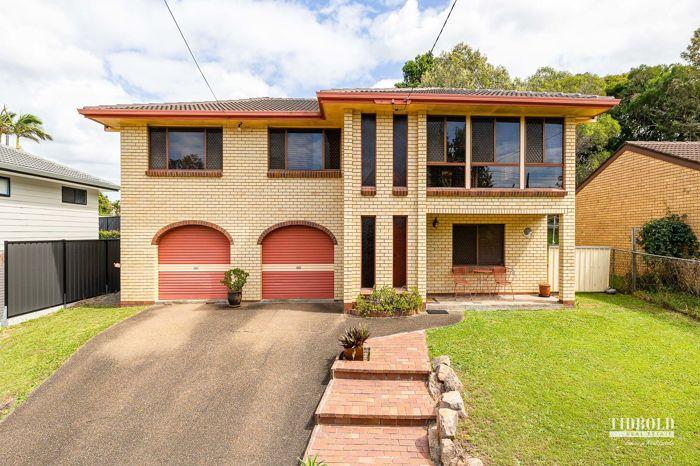
Recent sales nearby
See more recent sales nearby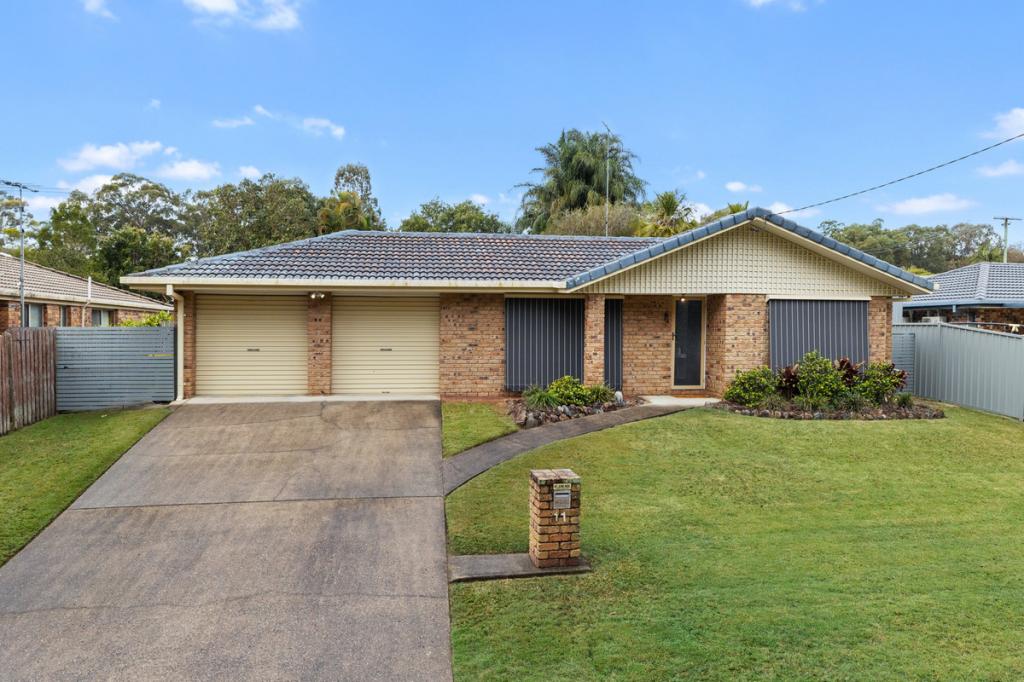 0
0
 0
0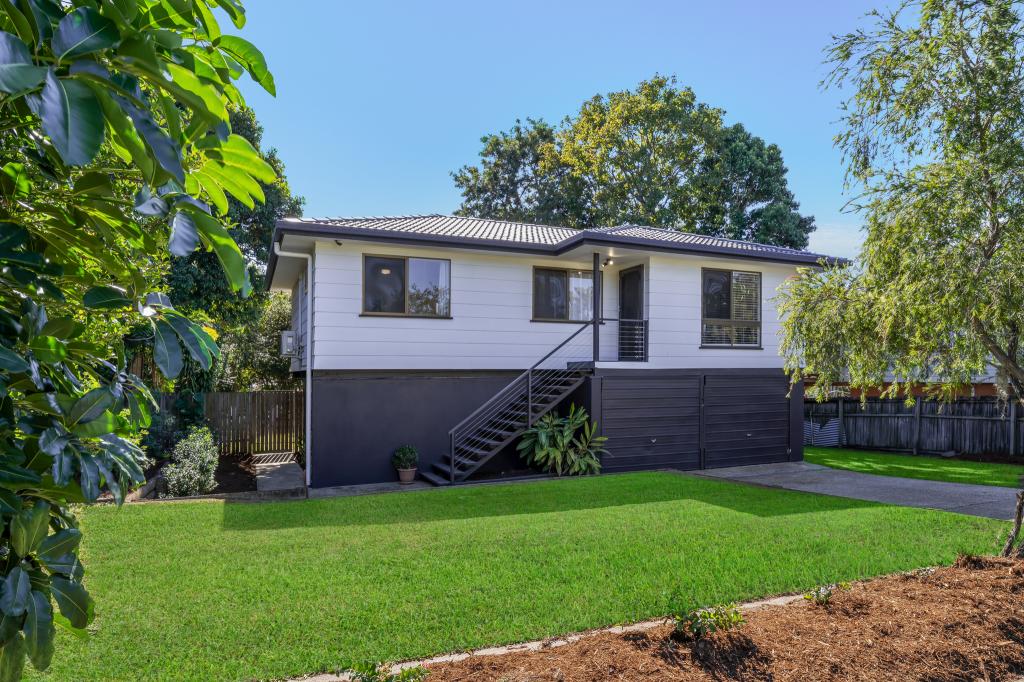 0
0Similar properties For Sale nearby
See more properties for sale nearby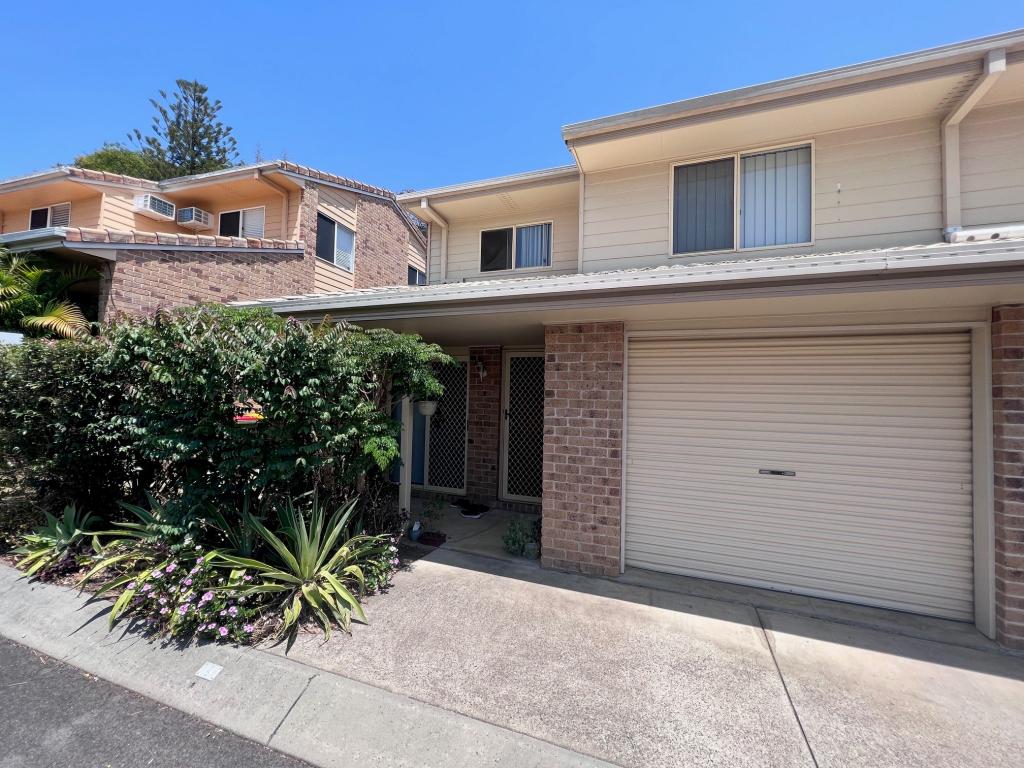 0
0
 0
0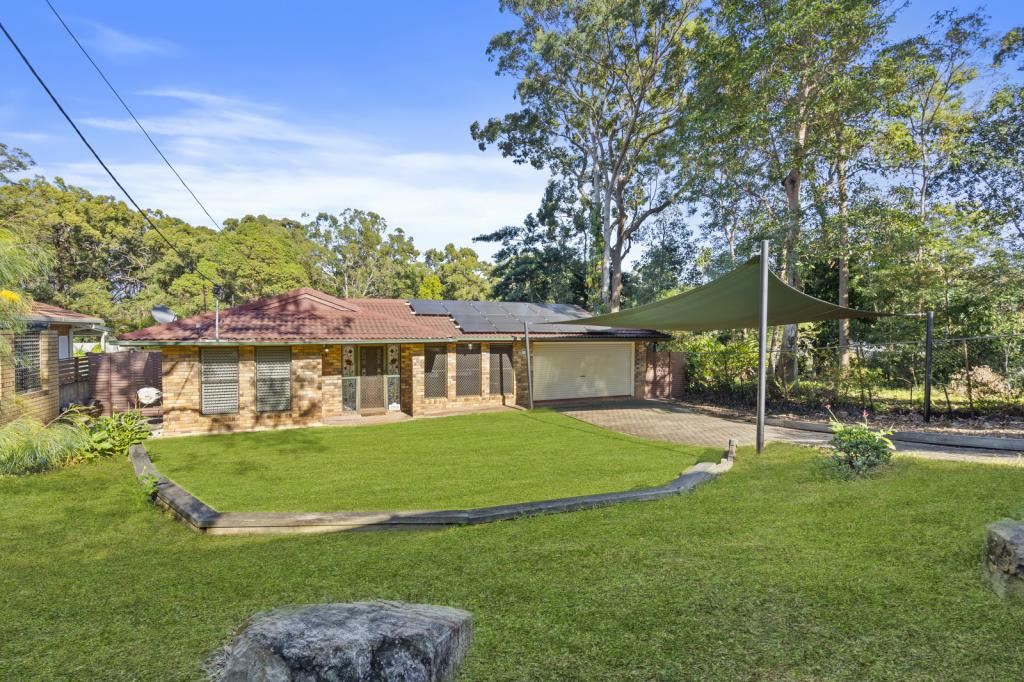 0
0Similar properties For Rent nearby
See more properties for rent nearby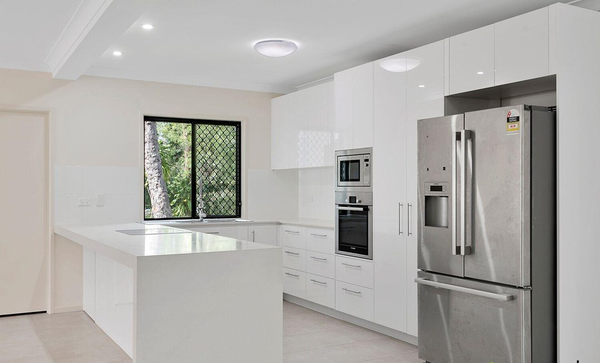 0
0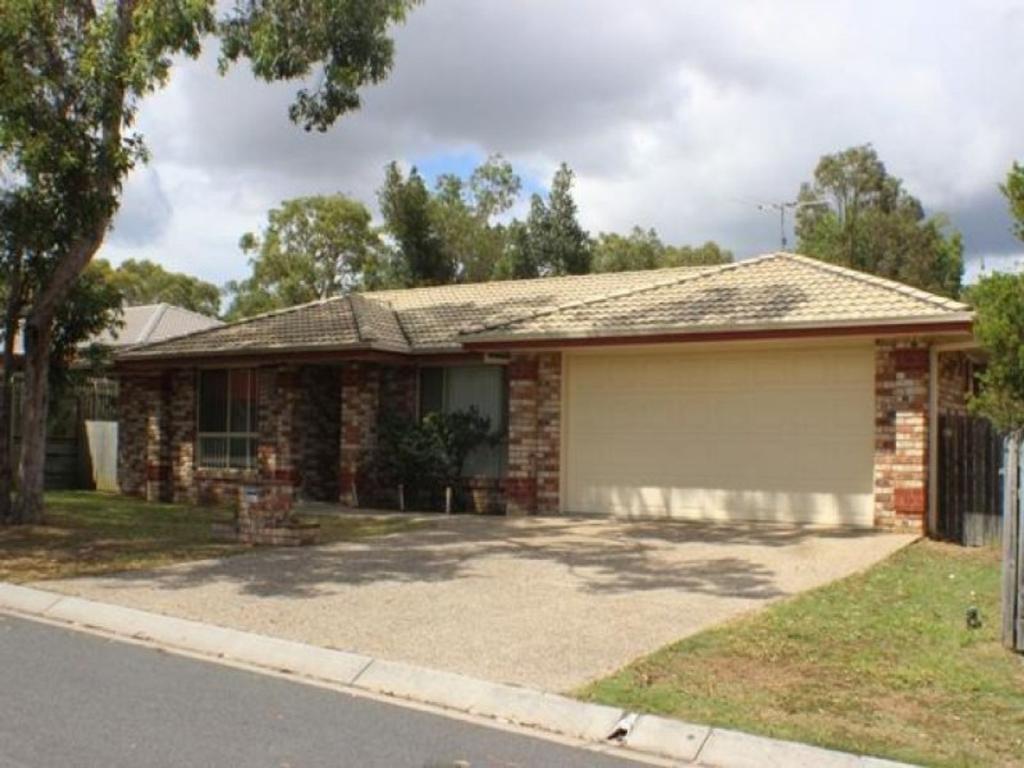 0
0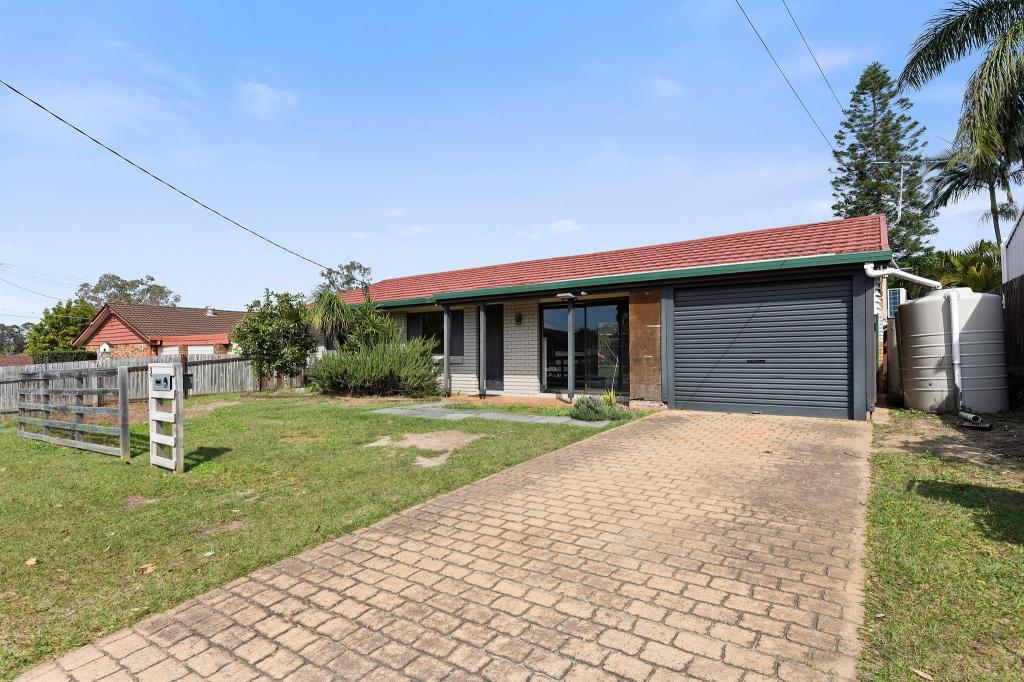 0
0About Capalaba 4157
The size of Capalaba is approximately 18.7 square kilometres. It has 42 parks covering nearly 11.2% of total area. The population of Capalaba in 2011 was 16,644 people. By 2016 the population was 17,365 showing a population growth of 4.3% in the area during that time. The predominant age group in Capalaba is 50-59 years. Households in Capalaba are primarily couples with children and are likely to be repaying $1800 - $2399 per month on mortgage repayments. In general, people in Capalaba work in a trades occupation. In 2011, 72.1% of the homes in Capalaba were owner-occupied compared with 71.4% in 2016.
Capalaba has 8,593 properties. Over the last 5 years, Houses in Capalaba have seen a 80.00% increase in median value, while Units have seen a 78.36% increase. As at 31 July 2024:
- The median value for Houses in Capalaba is $873,707 while the median value for Units is $559,645.
- Houses have a median rent of $650 while Units have a median rent of $550.
Suburb Insights for Capalaba 4157
Market Insights
Capalaba Trends for Houses
N/A
N/A
View TrendN/A
N/A
Capalaba Trends for Units
N/A
N/A
View TrendN/A
N/A
Neighbourhood Insights
© Copyright 2024 RP Data Pty Ltd trading as CoreLogic Asia Pacific (CoreLogic). All rights reserved.
This product uses cookies and other similar technologies to improve and customise your browsing experience, to tailor content and adverts, and for analytics and metrics regarding visitor usage on this product and other media. We may share cookie and analytics information with third parties for the purposes of advertising. By continuing to use our website, you consent to cookies being used. View our Privacy Policy here.
X