1 Veronica StreetCapalaba QLD 4157
Property Details for 1 Veronica St, Capalaba
Last Listing description (February 2025)
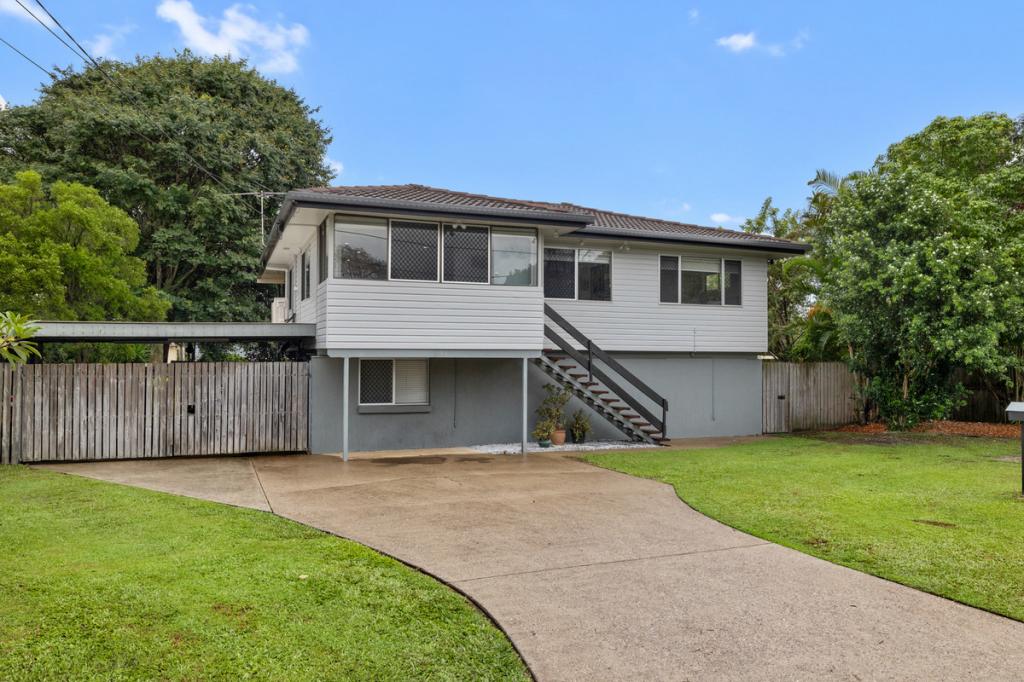
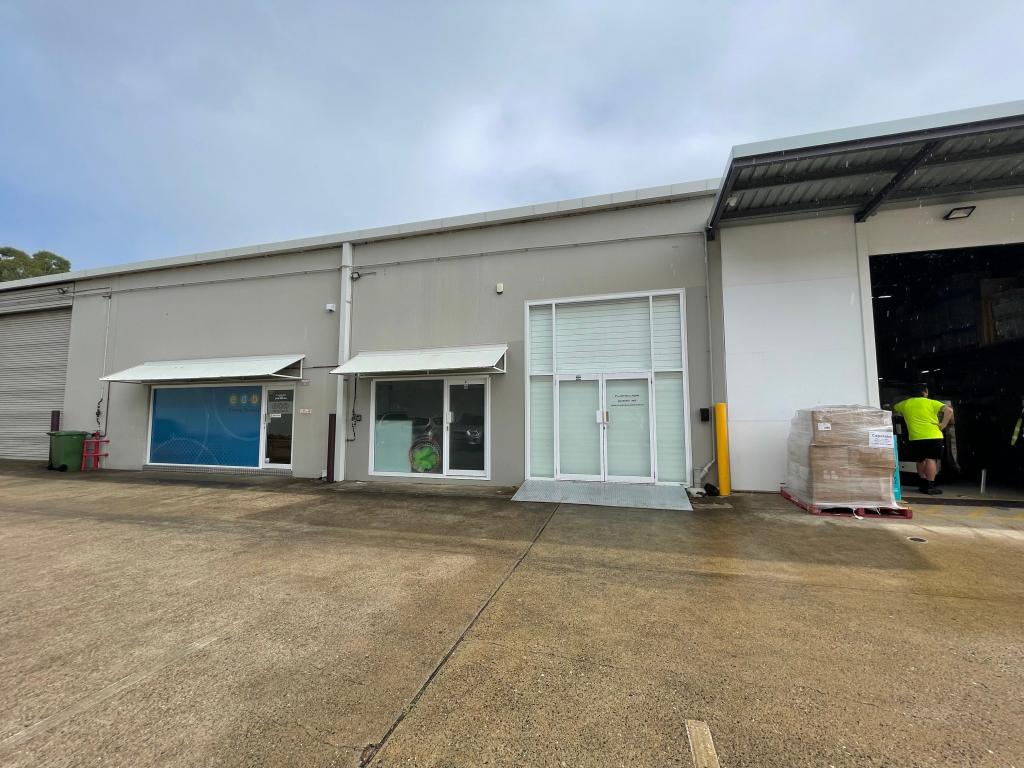
This 627sqm standalone building is located on the corner of Smith Street and Veronica Street and has excellent exposure to passing traffic.
Features include:
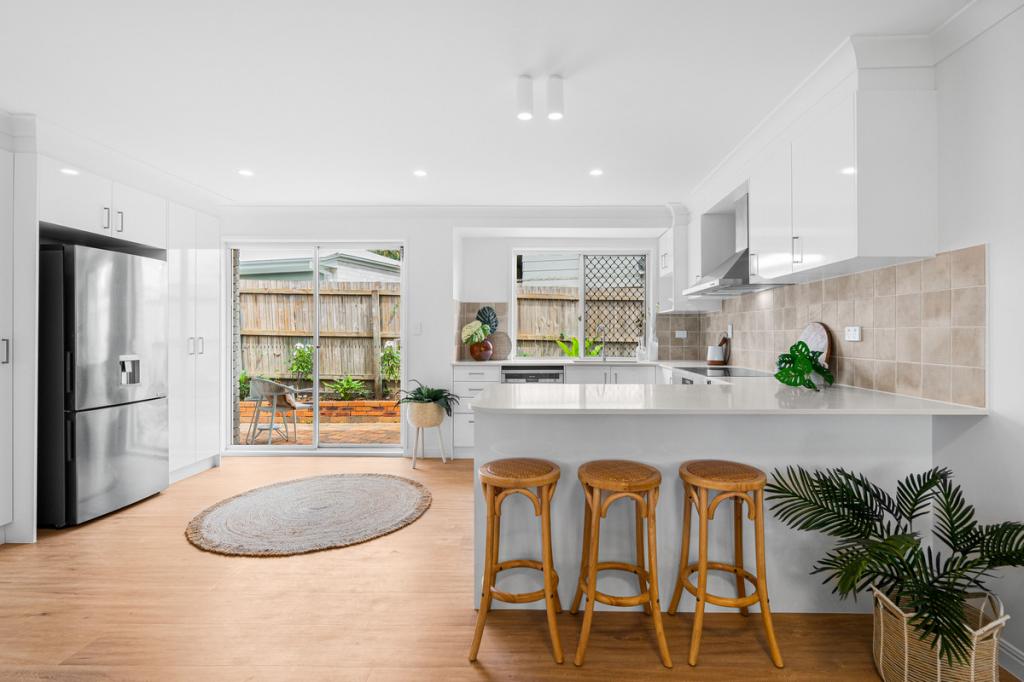
* 145sqm air conditioned office/showroom on the ground floor
* Well appointed kitchen/lunchroom
* 70sqm mezzanine storage
* 385sqm clear span warehouse with easy access
* Two container height rollers doors at front
* Own amenities - male and female toilets and a shower
* Additional 70sqm concrete hardstand with roller door access
* Secure site with electric gates and onsite parking
* Excellent signage and exposure to both Veronica Street and Smith Street
* All sizing noted above is approximate
For further information and to arrange an inspection please contact Exclusive Agent, Colin Tucker.
Property History for 1 Veronica St, Capalaba, QLD 4157
- 03 Feb 2025Sold for $2,295,000
- 09 Dec 2024Listed for Sale Expression of Interest
- 27 Aug 2018Sold for $1,350,000
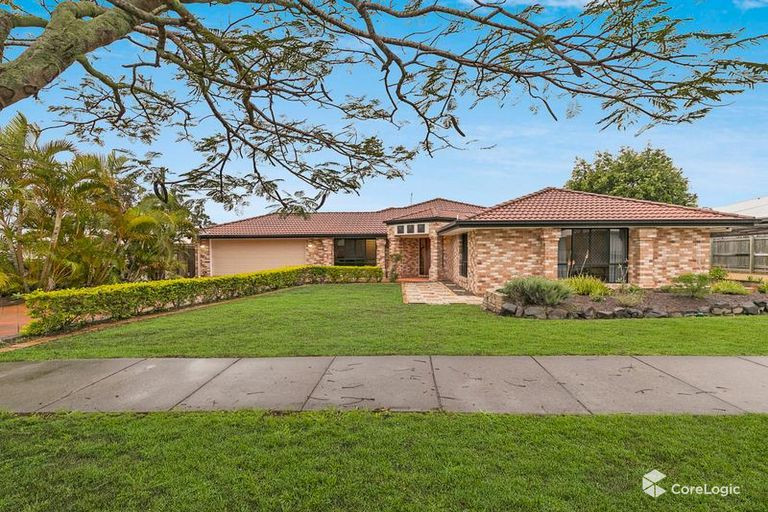
Recent sales nearby
See more recent sales nearbySimilar properties For Sale nearby
See more properties for sale nearby
Similar properties For Rent nearby
See more properties for rent nearby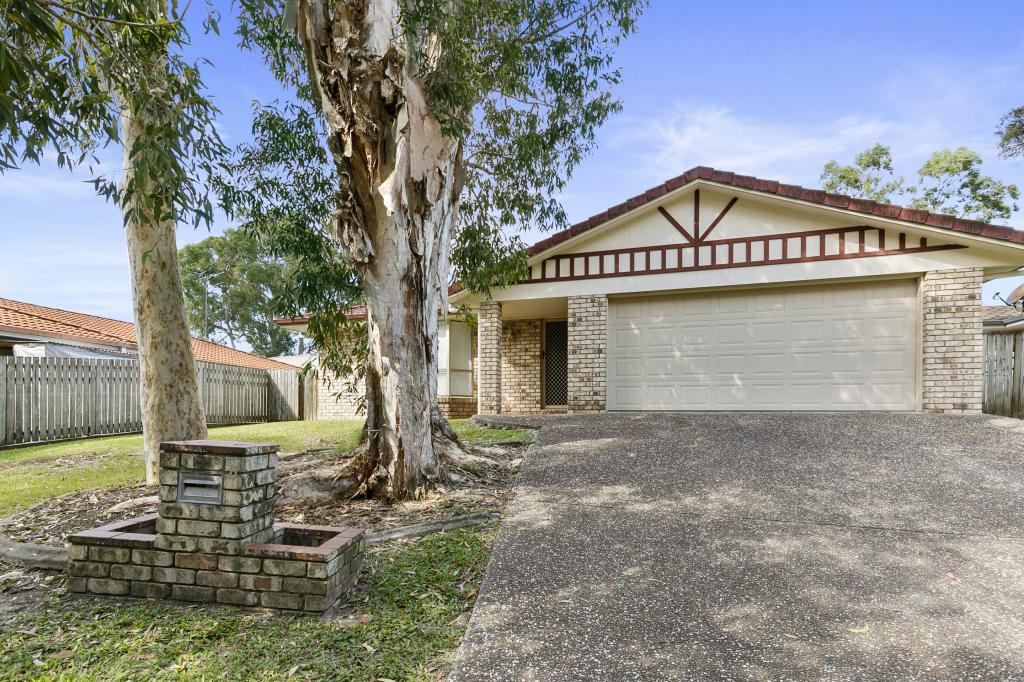
About Capalaba 4157
The size of Capalaba is approximately 18.7 square kilometres. It has 42 parks covering nearly 11.2% of total area. The population of Capalaba in 2011 was 16,644 people. By 2016 the population was 17,365 showing a population growth of 4.3% in the area during that time. The predominant age group in Capalaba is 50-59 years. Households in Capalaba are primarily couples with children and are likely to be repaying $1800 - $2399 per month on mortgage repayments. In general, people in Capalaba work in a trades occupation. In 2011, 72.1% of the homes in Capalaba were owner-occupied compared with 71.4% in 2016.
Capalaba has 8,588 properties. Over the last 5 years, Houses in Capalaba have seen a 88.62% increase in median value, while Units have seen a 91.66% increase. As at 28 February 2025:
- The median value for Houses in Capalaba is $911,600 while the median value for Units is $600,930.
- Houses have a median rent of $650 while Units have a median rent of $555.
What's around 1 Veronica St, Capalaba
1 Veronica St, Capalaba is in the school catchment zone for Capalaba State College.


Suburb Insights for Capalaba 4157
Market Insights
Capalaba Trends for Houses
$912k
10.61%
View Trend$650/W
4.04%
Capalaba Trends for Units
$601k
20.43%
View Trend$555/W
4.66%
Neighbourhood Insights
Age
Population 17,365
0-9
13%
10-19
12%
20-29
14%
30-39
14%
40-49
13%
50-59
14%
60-69
12%
70-79
6%
80-89
3%
90-99
1%
Household Structure
Occupancy
© Copyright 2025 RP Data Pty Ltd trading as CoreLogic Asia Pacific (CoreLogic). All rights reserved.
This product uses cookies and other similar technologies to improve and customise your browsing experience, to tailor content and adverts, and for analytics and metrics regarding visitor usage on this product and other media. We may share cookie and analytics information with third parties for the purposes of advertising. By continuing to use our website, you consent to cookies being used. View our Privacy Policy here.
X